BGS VLIM log M* ≥ 10.0, z < 0.18 — detailed systematic analysis
Intermediate-mass BGS VLIM sample (2,759,238 galaxies, z < 0.18). The LRT rejects the additive null at NSIDE 64 (\(\lambda_{\rm LR} = 123.9\)).
See also
Results: systematic weights — summary tables and figures for all nine samples.
Sample statistics
Parameter |
NSIDE 32 |
NSIDE 64 |
NSIDE 128 |
NSIDE 256 |
|---|---|---|---|---|
Stellar-mass threshold |
log M* ≥ 10.0 |
log M* ≥ 10.0 |
log M* ≥ 10.0 |
log M* ≥ 10.0 |
Redshift limit |
z < 0.18 |
z < 0.18 |
z < 0.18 |
z < 0.18 |
Ngal |
2,759,238 |
2,759,238 |
2,759,238 |
2,759,238 |
Npix (good footprint) |
5,616 |
21,667 |
84,860 |
332,734 |
Ntemplates |
11 |
11 |
11 |
11 |
MCMC walkers |
210 |
210 |
210 |
210 |
MCMC steps after burn-in |
1500 |
1500 |
1500 |
1500 |
Goodness-of-fit: \(\hat{\sigma}\) by method and resolution
The noise parameter \(\hat{\sigma}\) measures residual scatter after systematic subtraction — lower is better. Results are shown for NSIDE 32, 64, 128, and 256. ISD-3 is unavailable at NSIDE 128 and 256 (no partial files generated at those resolutions).
Method |
\(\hat{\sigma}\) (N32) |
\(\hat{\sigma}\) (N64) |
\(\hat{\sigma}\) (N128) |
\(\hat{\sigma}\) (N256) |
Notes |
|---|---|---|---|---|---|
OLS |
0.3801 |
0.3969 |
0.5606 |
0.8173 |
closed-form least-squares |
ElasticNet |
0.3820 |
0.3982 |
0.5616 |
0.8173 |
L1+L2 regularised; 3-fold CV |
ISD-1 |
0.3801 |
0.3969 |
0.5606 |
0.8173 |
iterative self-calibration; poly order 1 |
ISD-3 † |
1.0389 |
0.7254 |
0.6472 |
0.8355 |
† degree-3 polynomial; unavailable at NSIDE 128/256 |
MCMC-add |
0.3805 |
0.3969 |
0.5607 |
0.8173 |
MCMC additive; acc N32=0.386 N64=0.389 |
MCMC-comb |
0.4224 |
0.3817 |
0.5337 |
0.7855 |
MCMC combined; acc N32=0.281 N64=0.277 |
† ISD-3 uses a degree-3 polynomial expansion and is ill-conditioned with correlated templates.
Likelihood Ratio Test (additive vs combined model)
Resolution |
\(\lambda_{\rm LR}\) |
dof |
p-value |
Reject H₀ |
|---|---|---|---|---|
NSIDE 32 |
668.9 |
11 |
< 10-136 |
Yes |
NSIDE 64 |
123.9 |
11 |
< 10-21 |
Yes |
NSIDE 128 |
324.8 |
11 |
< 10-63 |
Yes |
NSIDE 256 |
1400.4 |
11 |
< 10-294 |
Yes |
MCMC acceptance fractions: NSIDE 32: add 0.386, comb 0.281 NSIDE 64: add 0.389, comb 0.277 NSIDE 128: add 0.388, comb 0.288 NSIDE 256: add 0.386, comb 0.306. Healthy range: 0.15–0.50.
Template amplitude ranking — additive model (MCMC-add, NSIDE 64)
All 11 templates sorted by absolute MCMC-add additive amplitude \(|\hat{a}_i|\). OLS shown for comparison.
Rank |
Template |
NSIDE |
\(\hat{a}_i\) (MCMC-add) |
\(\hat{a}_i\) (OLS) |
Physical meaning |
|---|---|---|---|---|---|
1 |
GAIA_nstar_faint |
64 |
+0.3631 |
+0.3681 |
GAIA faint stellar density (photometric mis-classification of faint stars as galaxies) |
2 |
GAIA_nstar_medium |
64 |
-0.2667 |
-0.2707 |
GAIA medium stellar density (crowding and deblending near bright stars) |
3 |
LS10_GALDEPTH_R_NSIDE_0064 |
? |
+0.0296 |
+0.0296 |
LS10_GALDEPTH_R_NSIDE_0064 |
4 |
GAIA_phot_rp_mean_flux |
64 |
-0.0165 |
-0.0168 |
GAIA mean stellar flux in RP band (red scattered light) |
5 |
LS10_NOBS_R_NSIDE_0064 |
? |
-0.0158 |
-0.0157 |
LS10_NOBS_R_NSIDE_0064 |
6 |
LS10_GALDEPTH_G_NSIDE_0064 |
? |
-0.0138 |
-0.0139 |
LS10_GALDEPTH_G_NSIDE_0064 |
7 |
LS10_GALDEPTH_Z_NSIDE_0064 |
? |
+0.0066 |
+0.0066 |
LS10_GALDEPTH_Z_NSIDE_0064 |
8 |
LS10_PSFSIZE_R_NSIDE_0064 |
? |
-0.0059 |
-0.0059 |
LS10_PSFSIZE_R_NSIDE_0064 |
9 |
GAIA_phot_g_mean_flux |
64 |
+0.0037 |
+0.0038 |
GAIA mean stellar flux in G band (scattered-light / sky-background variations) |
10 |
LS10_EBV_NSIDE_0064 |
? |
+0.0036 |
+0.0038 |
LS10_EBV_NSIDE_0064 |
11 |
GAIA_phot_bp_mean_flux |
64 |
-0.0029 |
-0.0027 |
GAIA mean stellar flux in BP band (blue scattered light) |
Template amplitude ranking — multiplicative model (MCMC-comb, NSIDE 64)
All 11 templates sorted by absolute MCMC-comb multiplicative amplitude \(|\hat{b}_i|\).
Rank |
Template |
NSIDE |
\(\hat{b}_i\) (MCMC-comb) |
Physical meaning |
|---|---|---|---|---|
1 |
GAIA_nstar_medium |
64 |
-0.1994 |
GAIA medium stellar density (crowding and deblending near bright stars) |
2 |
GAIA_nstar_faint |
64 |
+0.1685 |
GAIA faint stellar density (photometric mis-classification of faint stars as galaxies) |
3 |
LS10_GALDEPTH_R_NSIDE_0064 |
? |
+0.0540 |
LS10_GALDEPTH_R_NSIDE_0064 |
4 |
LS10_EBV_NSIDE_0064 |
? |
+0.0301 |
LS10_EBV_NSIDE_0064 |
5 |
LS10_GALDEPTH_G_NSIDE_0064 |
? |
-0.0256 |
LS10_GALDEPTH_G_NSIDE_0064 |
6 |
GAIA_phot_g_mean_flux |
64 |
-0.0167 |
GAIA mean stellar flux in G band (scattered-light / sky-background variations) |
7 |
GAIA_phot_rp_mean_flux |
64 |
+0.0121 |
GAIA mean stellar flux in RP band (red scattered light) |
8 |
GAIA_phot_bp_mean_flux |
64 |
-0.0108 |
GAIA mean stellar flux in BP band (blue scattered light) |
9 |
LS10_PSFSIZE_R_NSIDE_0064 |
? |
+0.0098 |
LS10_PSFSIZE_R_NSIDE_0064 |
10 |
LS10_NOBS_R_NSIDE_0064 |
? |
-0.0089 |
LS10_NOBS_R_NSIDE_0064 |
11 |
LS10_GALDEPTH_Z_NSIDE_0064 |
? |
+0.0002 |
LS10_GALDEPTH_Z_NSIDE_0064 |
Per-galaxy weight statistics (NSIDE 64)
From the *_NSIDE0064_WEIGHTS.fits file. Mean ≈ 1 and small std indicate a well-behaved weight distribution.
Method |
N |
mean |
std |
p1 |
p5 |
p50 |
p95 |
p99 |
|---|---|---|---|---|---|---|---|---|
OLS |
2,759,238 |
0.9988 |
0.0318 |
0.9069 |
0.9642 |
0.9947 |
1.0522 |
1.0857 |
ElasticNet |
2,759,238 |
1.0000 |
0.0000 |
1.0000 |
1.0000 |
1.0000 |
1.0000 |
1.0000 |
ISD-1 |
2,759,238 |
0.9988 |
0.0322 |
0.9095 |
0.9637 |
0.9944 |
1.0534 |
1.0870 |
ISD-3 † |
2,759,238 |
1.5589 |
8.0266 |
0.4367 |
0.6659 |
0.8487 |
1.2795 |
2.3825 |
MCMC-add |
2,759,238 |
0.9989 |
0.0317 |
0.9072 |
0.9645 |
0.9948 |
1.0517 |
1.0850 |
MCMC-comb |
2,759,238 |
0.9652 |
0.0424 |
0.8188 |
0.9110 |
0.9669 |
1.0185 |
1.0811 |
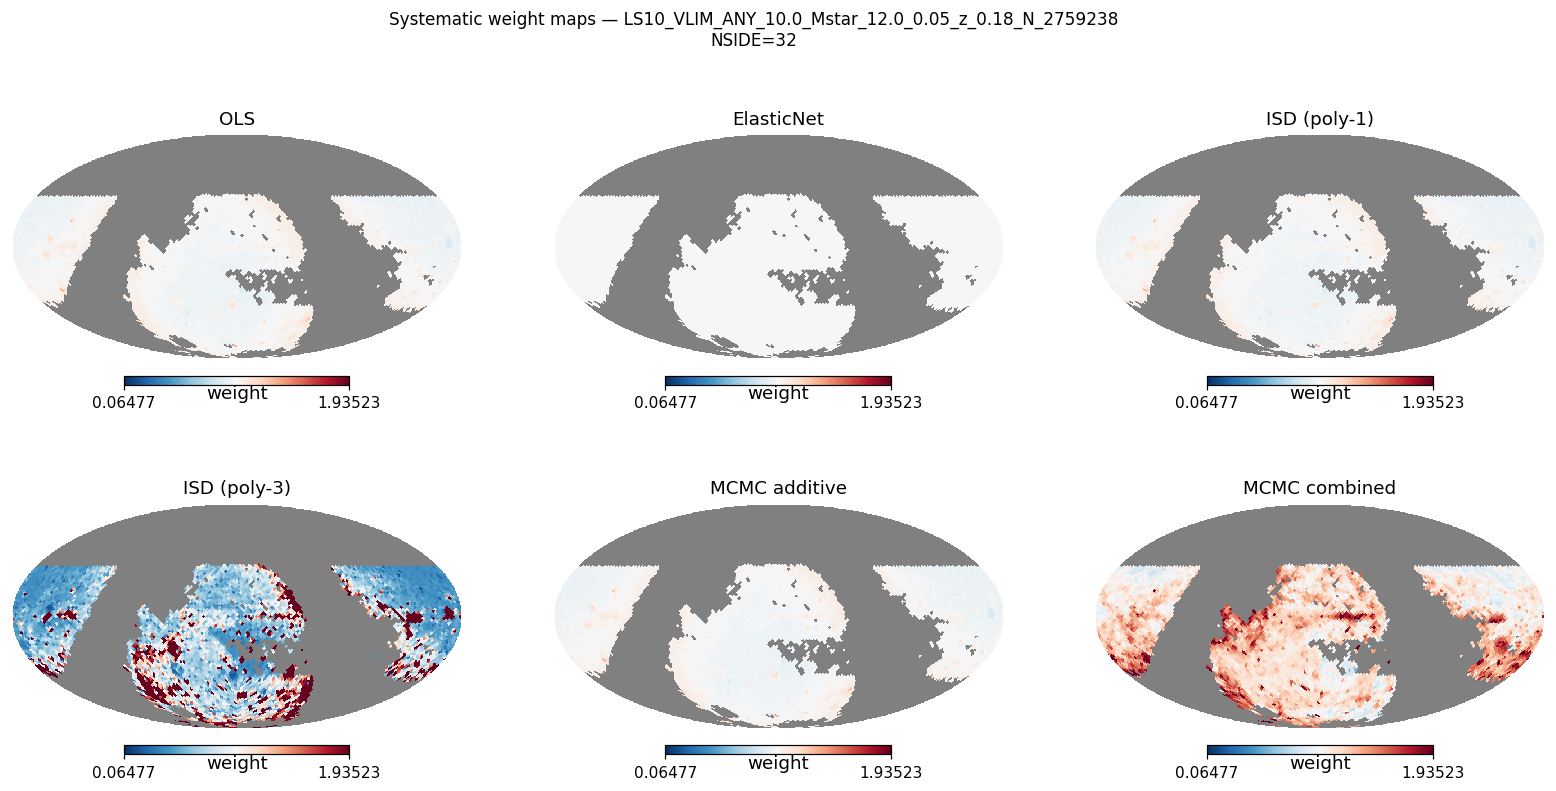
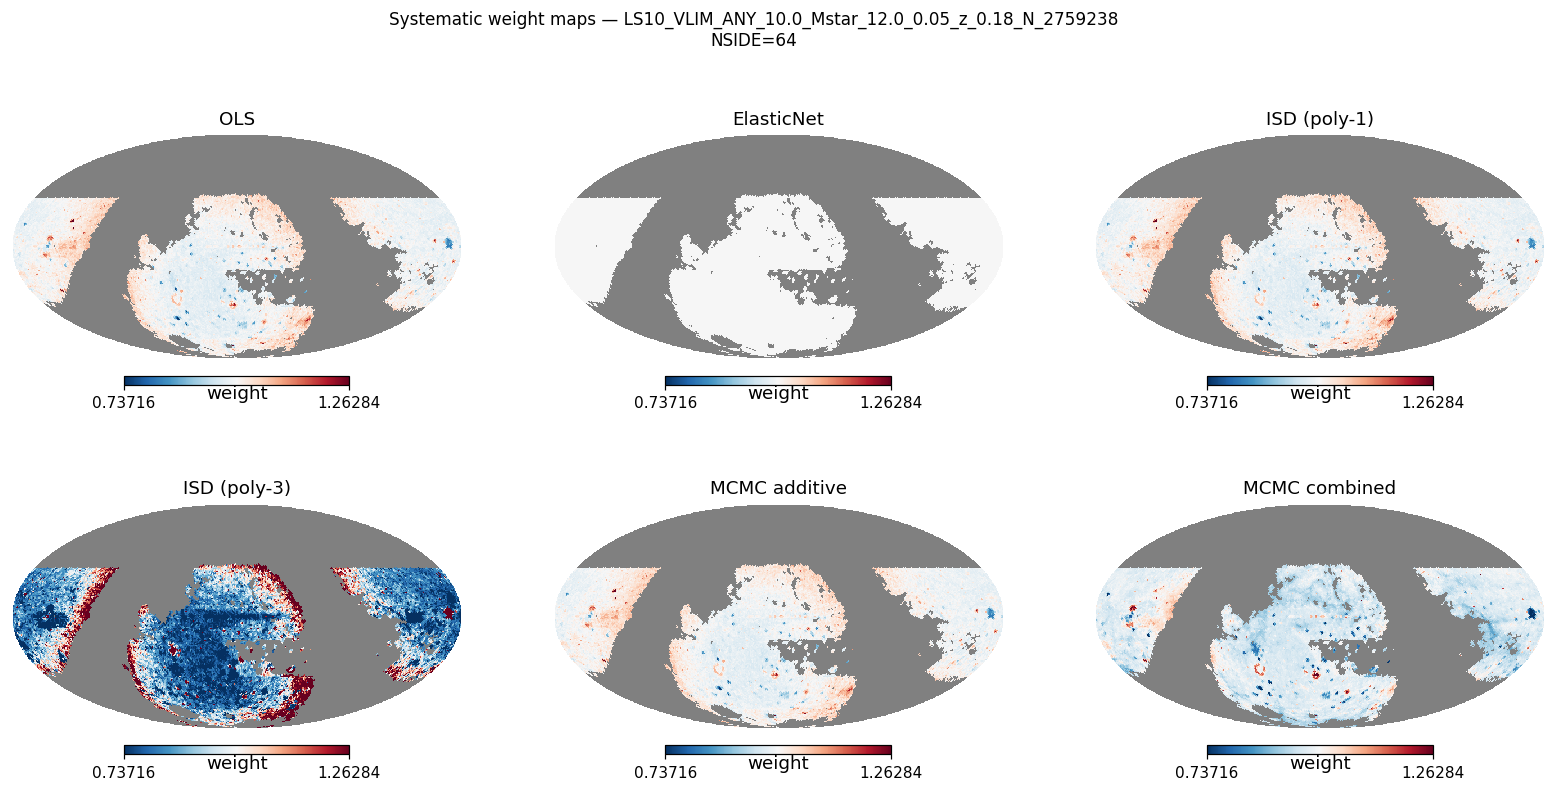
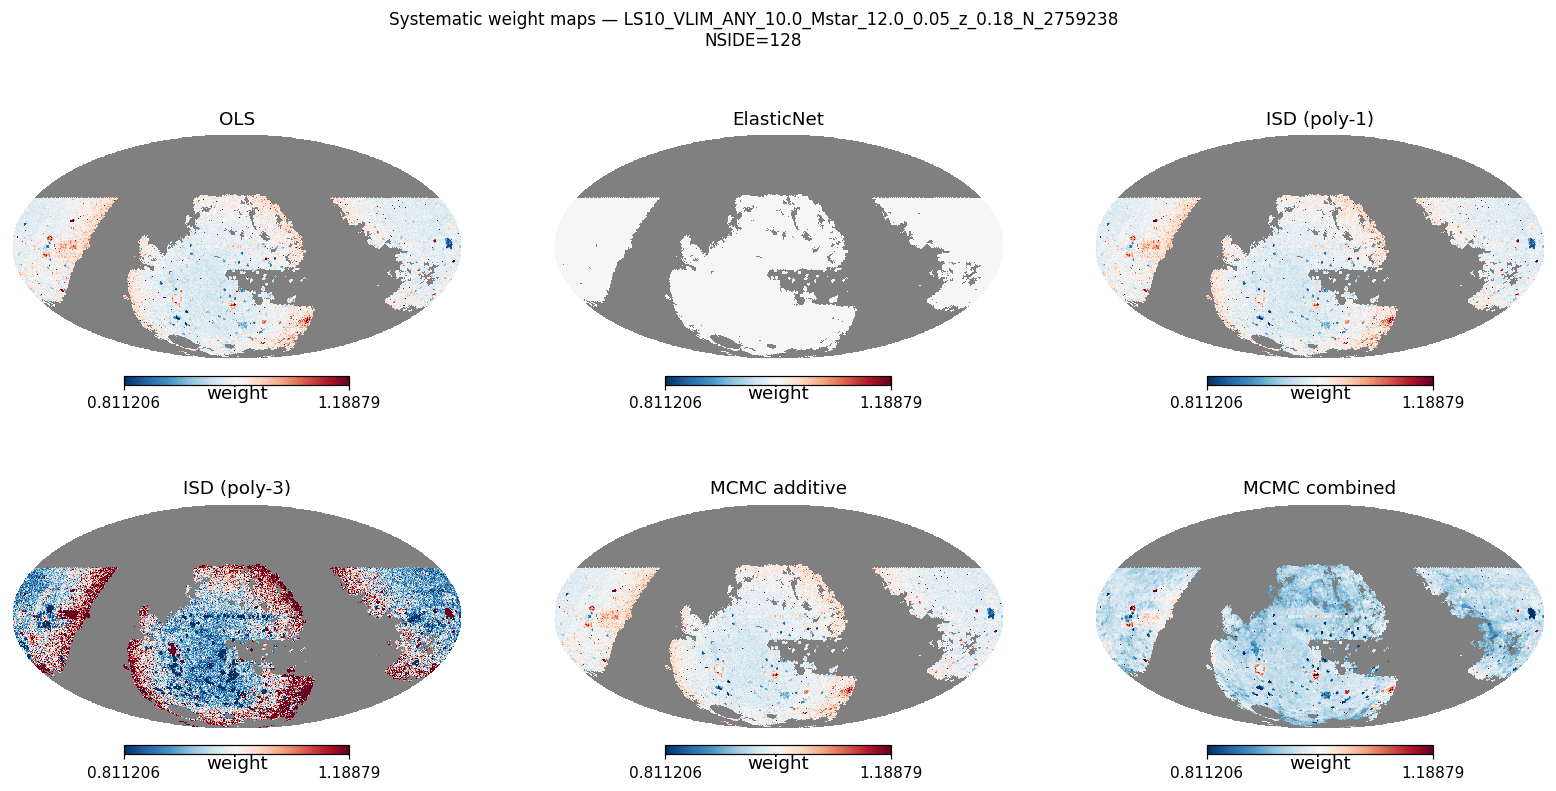
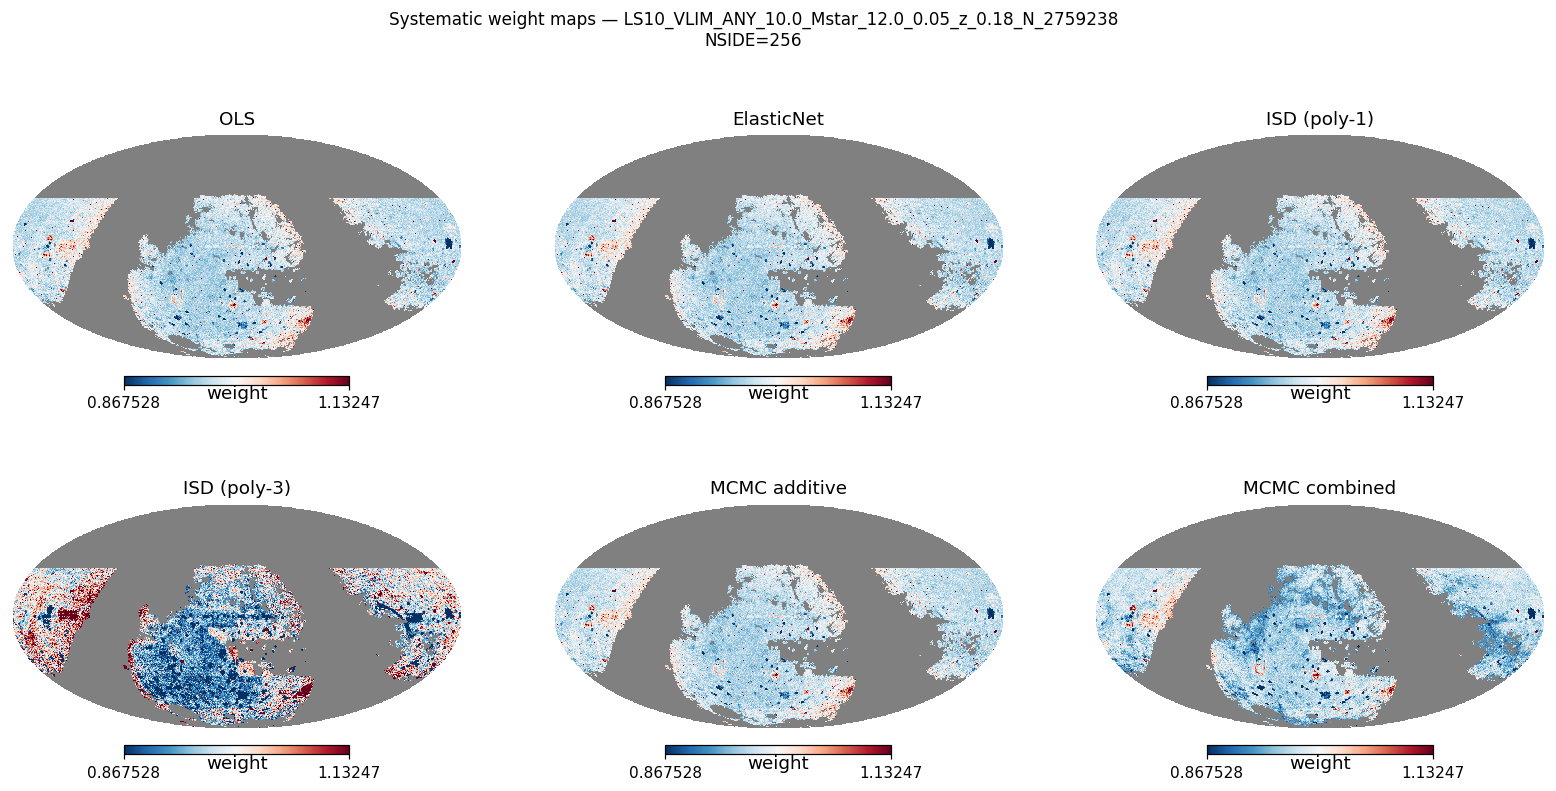
Systematic weight maps
Mollweide weight maps — all six methods
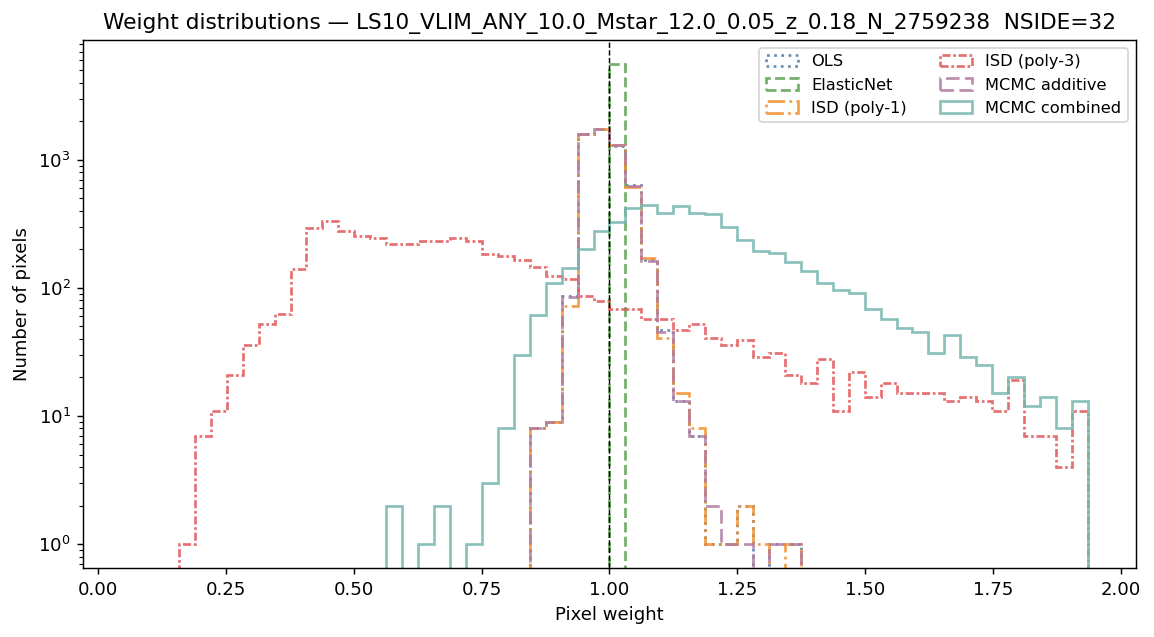
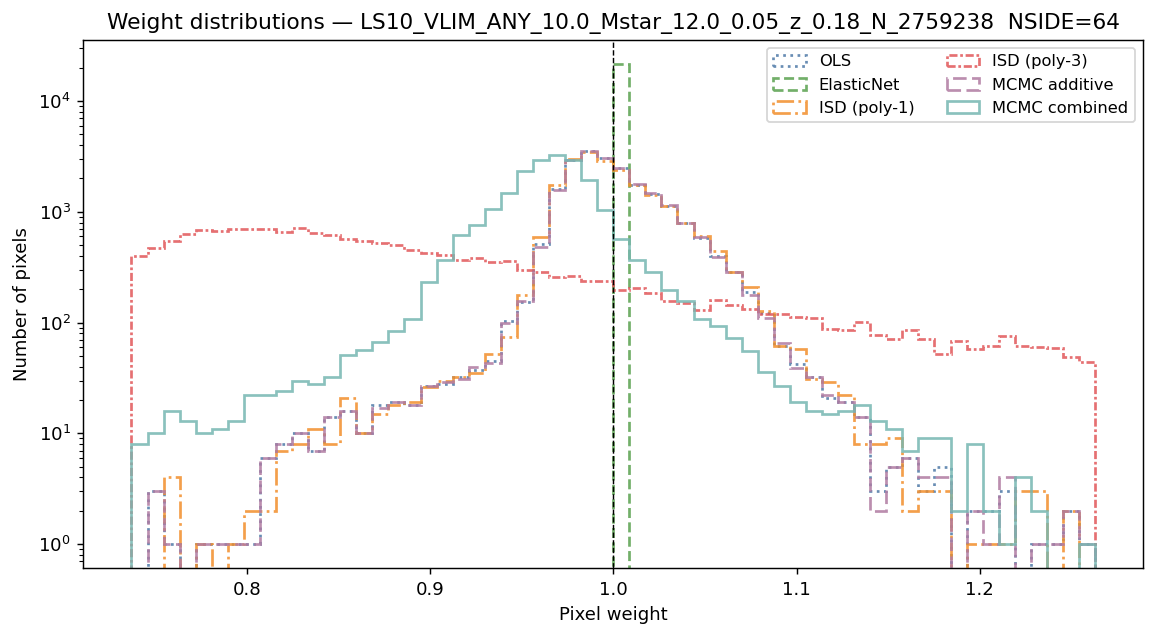
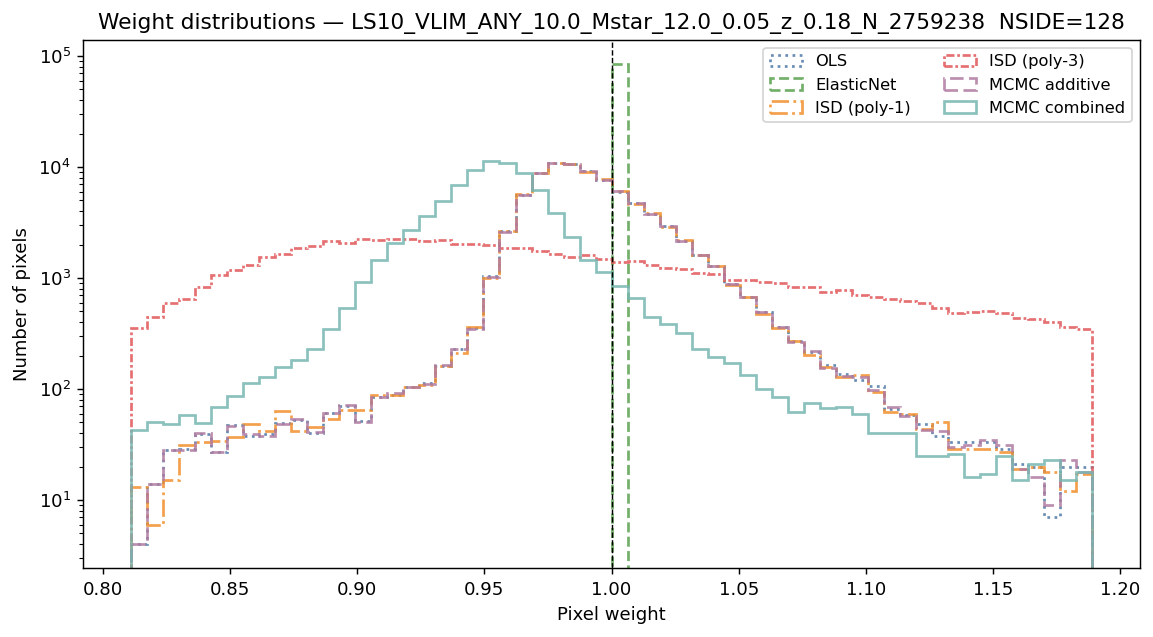
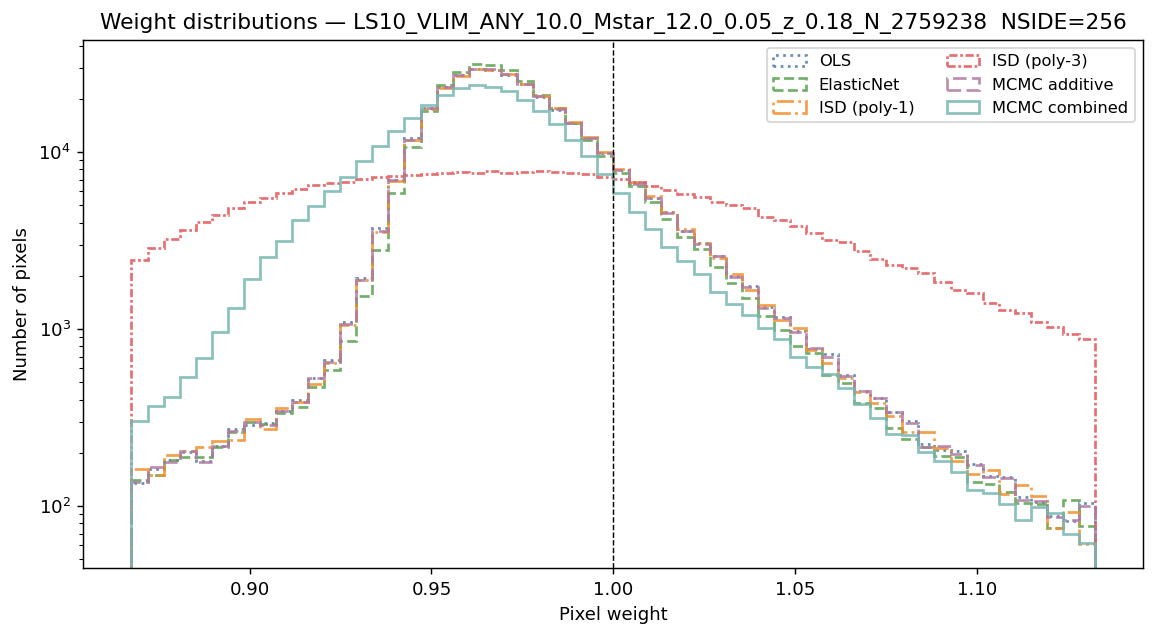
Systematic weight distributions
Narrow peaks near 1 indicate stable weight estimates. ElasticNet weights may be exactly 1 when cross-validation selects zero amplitudes.
Per-galaxy weight distributions — all six methods
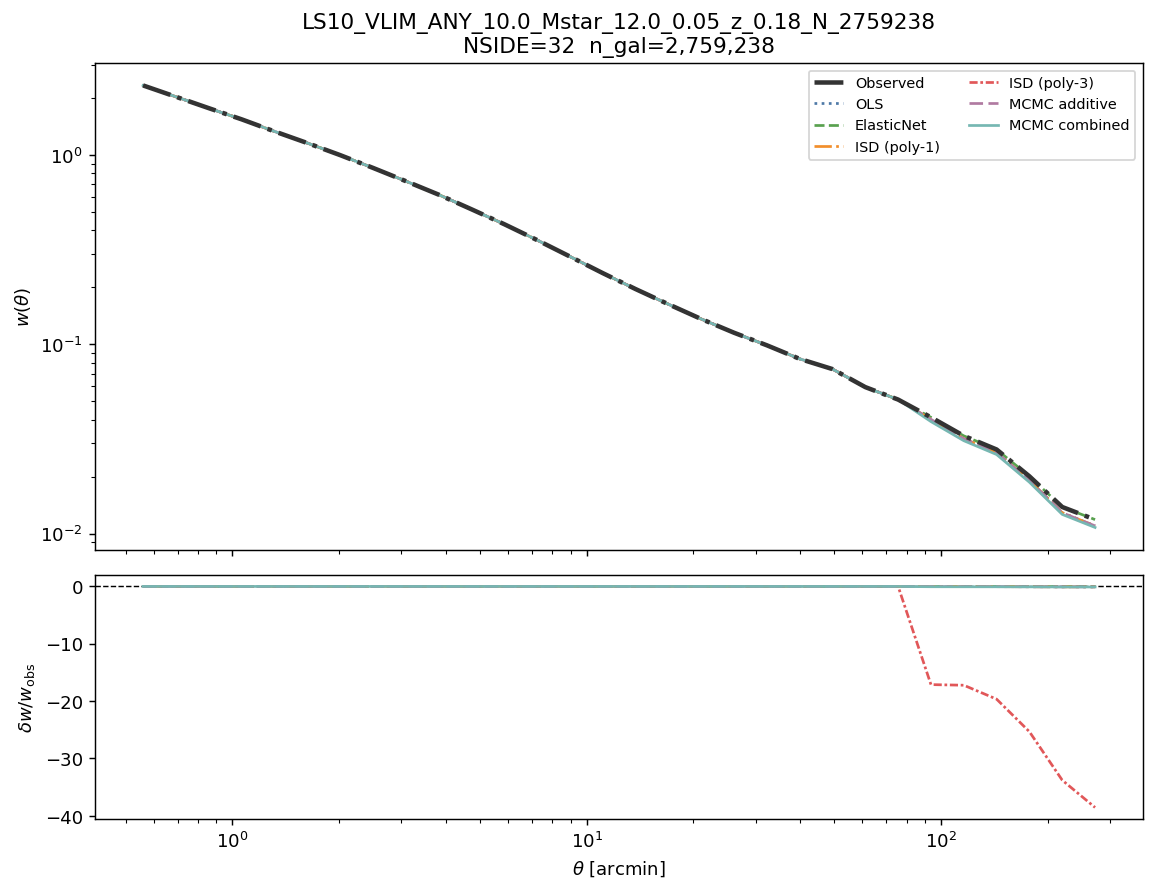
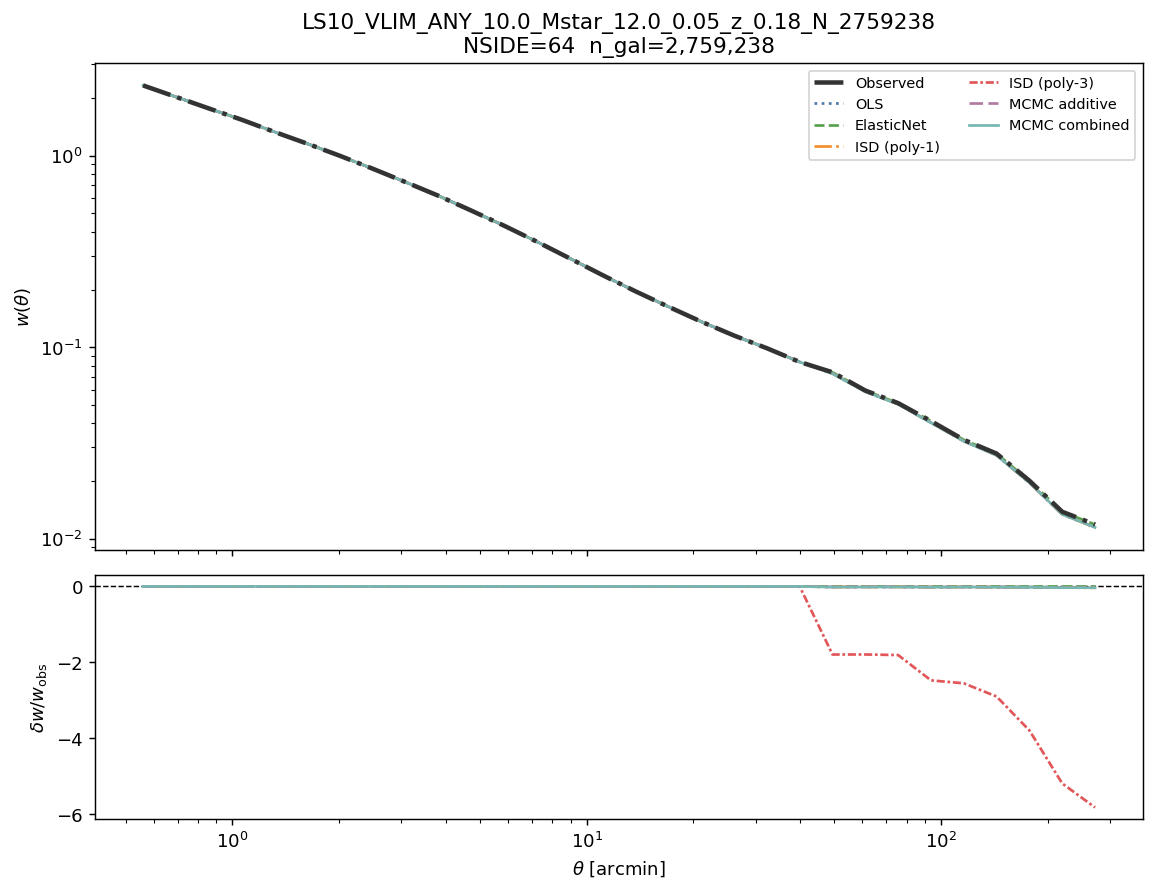
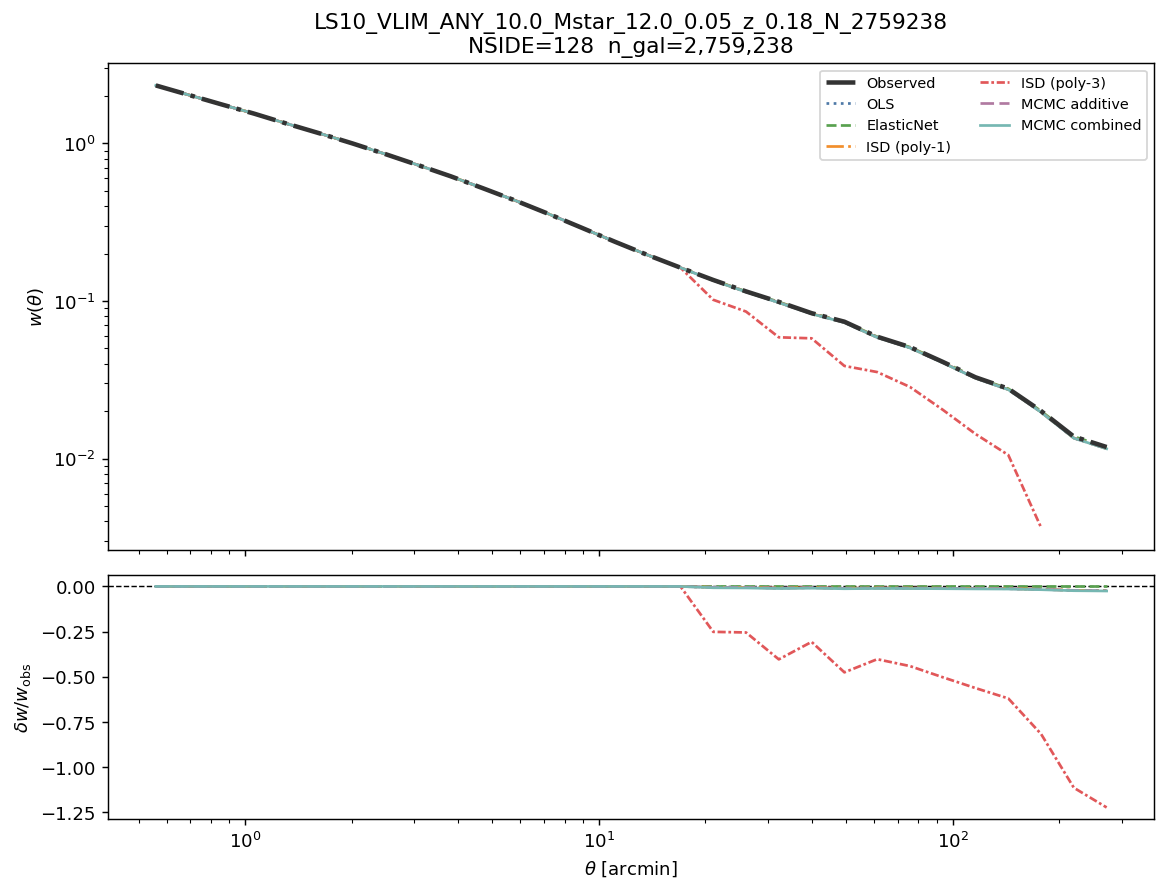
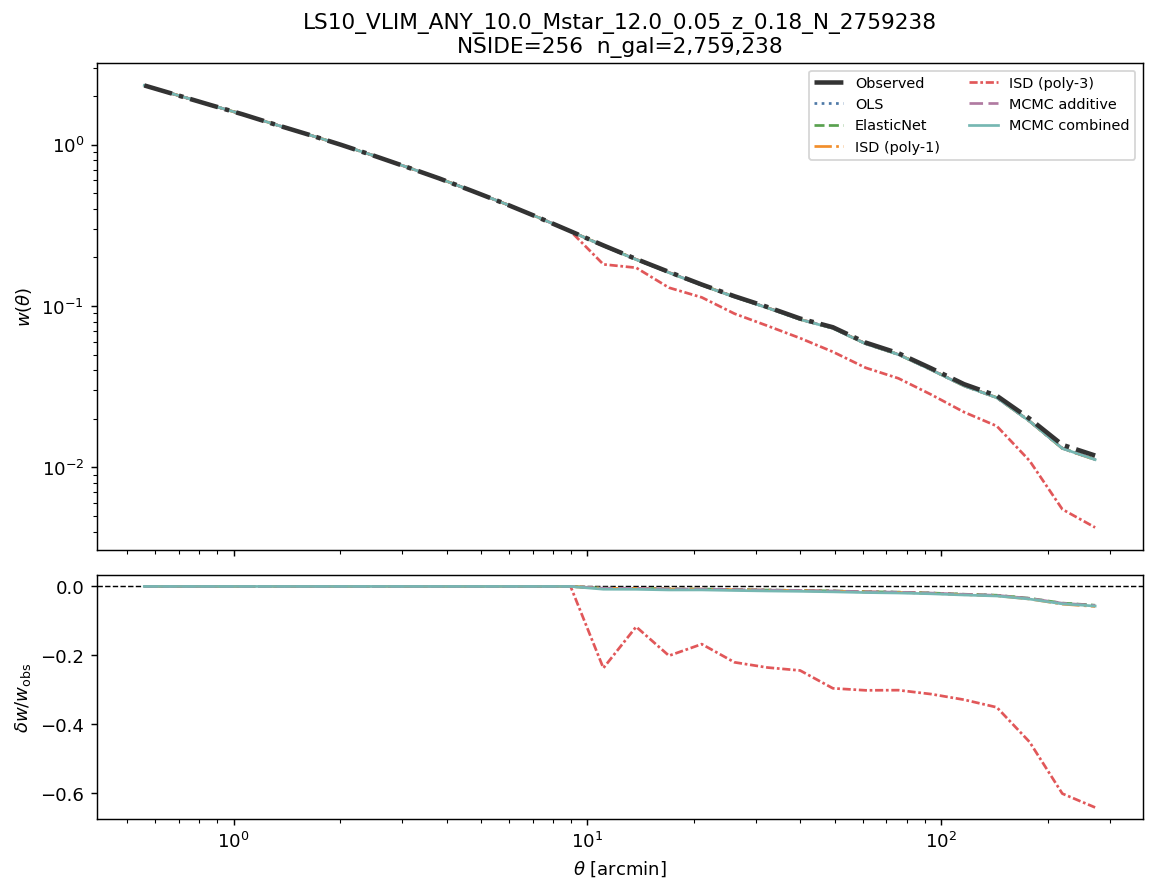
Angular clustering w(θ) before and after correction
Each panel shows the observed angular two-point correlation function (solid black) and the corrected \(w(\theta)\) for all six methods. A well-corrected sample shows suppressed excess clustering at all scales. Each panel corresponds to one map resolution.
w(θ): observed vs corrected — all six methods
Cosmological analysis verdict
Sub-degree scales (\(\theta < 30'\)): regime is sub-percent contamination (below noise floor) (\(\delta w/w \approx -0.4\%\) at 30 arcmin).
Without correction: suitable even without correction.
After correction: suitable — correction provides marginal improvement.
LRT (NSIDE 64): \(\lambda_{\rm LR} = 123.9\) (dof = 11), p = 2.9e-21 → Reject H₀ — multiplicative contamination is statistically detected.
Recommendation: use WEIGHT_COMB (WEIGHT_SYS) for all science-grade analyses.