BGS VLIM log M* ≥ 9.0, z < 0.08 — detailed systematic analysis
One of the two most contaminated BGS VLIM samples. With 523,486 galaxies at z < 0.08, faint stellar contamination dominates the systematic budget. The LRT strongly detects multiplicative contamination at both resolutions (\(\lambda_{\rm LR} = 1489.5\) at NSIDE 64).
See also
Results: systematic weights — summary tables and figures for all nine samples.
Sample statistics
Parameter |
NSIDE 32 |
NSIDE 64 |
NSIDE 128 |
NSIDE 256 |
|---|---|---|---|---|
Stellar-mass threshold |
log M* ≥ 9.0 |
log M* ≥ 9.0 |
log M* ≥ 9.0 |
log M* ≥ 9.0 |
Redshift limit |
z < 0.08 |
z < 0.08 |
z < 0.08 |
z < 0.08 |
Ngal |
523,486 |
523,486 |
523,486 |
523,486 |
Npix (good footprint) |
5,612 |
21,563 |
84,367 |
324,258 |
Ntemplates |
11 |
11 |
11 |
11 |
MCMC walkers |
210 |
210 |
210 |
210 |
MCMC steps after burn-in |
1500 |
1500 |
1500 |
1500 |
Goodness-of-fit: \(\hat{\sigma}\) by method and resolution
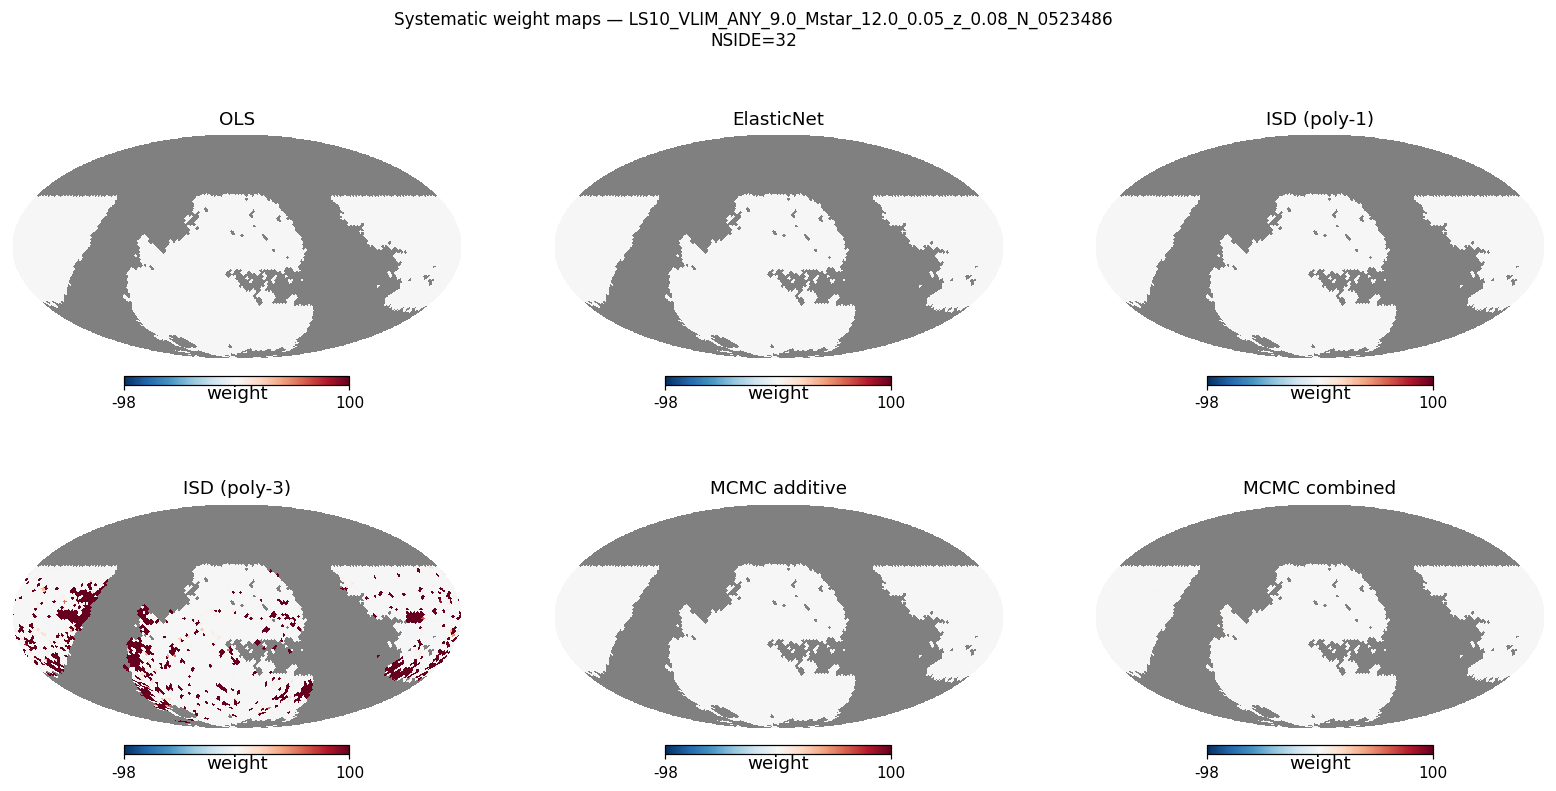
The noise parameter \(\hat{\sigma}\) measures residual scatter after systematic subtraction — lower is better. Results are shown for NSIDE 32, 64, 128, and 256. ISD-3 is unavailable at NSIDE 128 and 256 (no partial files generated at those resolutions).
Method |
\(\hat{\sigma}\) (N32) |
\(\hat{\sigma}\) (N64) |
\(\hat{\sigma}\) (N128) |
\(\hat{\sigma}\) (N256) |
Notes |
|---|---|---|---|---|---|
OLS |
0.5474 |
0.6760 |
0.9909 |
1.6568 |
closed-form least-squares |
ElasticNet |
0.5491 |
0.6768 |
0.9912 |
1.6570 |
L1+L2 regularised; 3-fold CV |
ISD-1 |
0.5474 |
0.6760 |
0.9910 |
1.6568 |
iterative self-calibration; poly order 1 |
ISD-3 † |
2.9223 |
3.2810 |
1.4628 |
1.7204 |
† degree-3 polynomial; unavailable at NSIDE 128/256 |
MCMC-add |
0.5483 |
0.6762 |
0.9911 |
1.6568 |
MCMC additive; acc N32=0.388 N64=0.390 |
MCMC-comb |
0.6736 |
0.7511 |
1.0288 |
1.6008 |
MCMC combined; acc N32=0.285 N64=0.296 |
† ISD-3 uses a degree-3 polynomial expansion and is ill-conditioned with correlated templates.
Likelihood Ratio Test (additive vs combined model)
Resolution |
\(\lambda_{\rm LR}\) |
dof |
p-value |
Reject H₀ |
|---|---|---|---|---|
NSIDE 32 |
404.2 |
11 |
< 10-80 |
Yes |
NSIDE 64 |
1489.5 |
11 |
< 10-300 |
Yes |
NSIDE 128 |
3523.5 |
11 |
< 10-300 |
Yes |
NSIDE 256 |
7590.4 |
11 |
< 10-300 |
Yes |
MCMC acceptance fractions: NSIDE 32: add 0.388, comb 0.285 NSIDE 64: add 0.390, comb 0.296 NSIDE 128: add 0.388, comb 0.298 NSIDE 256: add 0.387, comb 0.310. Healthy range: 0.15–0.50.
Template amplitude ranking — additive model (MCMC-add, NSIDE 64)
All 11 templates sorted by absolute MCMC-add additive amplitude \(|\hat{a}_i|\). OLS shown for comparison.
Rank |
Template |
NSIDE |
\(\hat{a}_i\) (MCMC-add) |
\(\hat{a}_i\) (OLS) |
Physical meaning |
|---|---|---|---|---|---|
1 |
GAIA_nstar_faint |
64 |
+0.4449 |
+0.4553 |
GAIA faint stellar density (photometric mis-classification of faint stars as galaxies) |
2 |
GAIA_nstar_medium |
64 |
-0.3143 |
-0.3218 |
GAIA medium stellar density (crowding and deblending near bright stars) |
3 |
LS10_GALDEPTH_R_NSIDE_0064 |
? |
+0.0826 |
+0.0824 |
LS10_GALDEPTH_R_NSIDE_0064 |
4 |
GAIA_phot_g_mean_flux |
64 |
+0.0372 |
+0.0375 |
GAIA mean stellar flux in G band (scattered-light / sky-background variations) |
5 |
GAIA_phot_rp_mean_flux |
64 |
-0.0339 |
-0.0346 |
GAIA mean stellar flux in RP band (red scattered light) |
6 |
LS10_GALDEPTH_G_NSIDE_0064 |
? |
-0.0266 |
-0.0264 |
LS10_GALDEPTH_G_NSIDE_0064 |
7 |
GAIA_phot_bp_mean_flux |
64 |
-0.0246 |
-0.0245 |
GAIA mean stellar flux in BP band (blue scattered light) |
8 |
LS10_EBV_NSIDE_0064 |
? |
-0.0211 |
-0.0208 |
LS10_EBV_NSIDE_0064 |
9 |
LS10_PSFSIZE_R_NSIDE_0064 |
? |
-0.0086 |
-0.0088 |
LS10_PSFSIZE_R_NSIDE_0064 |
10 |
LS10_NOBS_R_NSIDE_0064 |
? |
-0.0040 |
-0.0037 |
LS10_NOBS_R_NSIDE_0064 |
11 |
LS10_GALDEPTH_Z_NSIDE_0064 |
? |
+0.0002 |
+0.0001 |
LS10_GALDEPTH_Z_NSIDE_0064 |
Template amplitude ranking — multiplicative model (MCMC-comb, NSIDE 64)
All 11 templates sorted by absolute MCMC-comb multiplicative amplitude \(|\hat{b}_i|\).
Rank |
Template |
NSIDE |
\(\hat{b}_i\) (MCMC-comb) |
Physical meaning |
|---|---|---|---|---|
1 |
GAIA_nstar_faint |
64 |
+1.1908 |
GAIA faint stellar density (photometric mis-classification of faint stars as galaxies) |
2 |
GAIA_nstar_medium |
64 |
-0.6523 |
GAIA medium stellar density (crowding and deblending near bright stars) |
3 |
LS10_GALDEPTH_R_NSIDE_0064 |
? |
+0.1162 |
LS10_GALDEPTH_R_NSIDE_0064 |
4 |
LS10_GALDEPTH_Z_NSIDE_0064 |
? |
+0.0850 |
LS10_GALDEPTH_Z_NSIDE_0064 |
5 |
GAIA_phot_rp_mean_flux |
64 |
-0.0428 |
GAIA mean stellar flux in RP band (red scattered light) |
6 |
GAIA_phot_g_mean_flux |
64 |
+0.0280 |
GAIA mean stellar flux in G band (scattered-light / sky-background variations) |
7 |
LS10_PSFSIZE_R_NSIDE_0064 |
? |
+0.0194 |
LS10_PSFSIZE_R_NSIDE_0064 |
8 |
LS10_GALDEPTH_G_NSIDE_0064 |
? |
-0.0181 |
LS10_GALDEPTH_G_NSIDE_0064 |
9 |
LS10_NOBS_R_NSIDE_0064 |
? |
-0.0147 |
LS10_NOBS_R_NSIDE_0064 |
10 |
LS10_EBV_NSIDE_0064 |
? |
+0.0069 |
LS10_EBV_NSIDE_0064 |
11 |
GAIA_phot_bp_mean_flux |
64 |
-0.0060 |
GAIA mean stellar flux in BP band (blue scattered light) |
Per-galaxy weight statistics (NSIDE 64)
From the *_NSIDE0064_WEIGHTS.fits file. Mean ≈ 1 and small std indicate a well-behaved weight distribution.
Method |
N |
mean |
std |
p1 |
p5 |
p50 |
p95 |
p99 |
|---|---|---|---|---|---|---|---|---|
OLS |
523,486 |
0.9982 |
0.0784 |
0.7017 |
0.8990 |
1.0014 |
1.1066 |
1.1536 |
ElasticNet |
523,486 |
0.9940 |
0.0617 |
0.7431 |
0.9109 |
1.0098 |
1.0656 |
1.0803 |
ISD-1 |
523,486 |
0.9977 |
0.0764 |
0.7209 |
0.8996 |
1.0000 |
1.1073 |
1.1534 |
ISD-3 † |
523,486 |
5.3726 |
20.1056 |
0.2569 |
0.4193 |
0.7584 |
9.5656 |
100.0000 |
MCMC-add |
523,486 |
0.9980 |
0.0782 |
0.7014 |
0.8990 |
1.0014 |
1.1056 |
1.1526 |
MCMC-comb |
523,486 |
1.1465 |
0.1532 |
0.5996 |
0.8654 |
1.1828 |
1.3321 |
1.4106 |
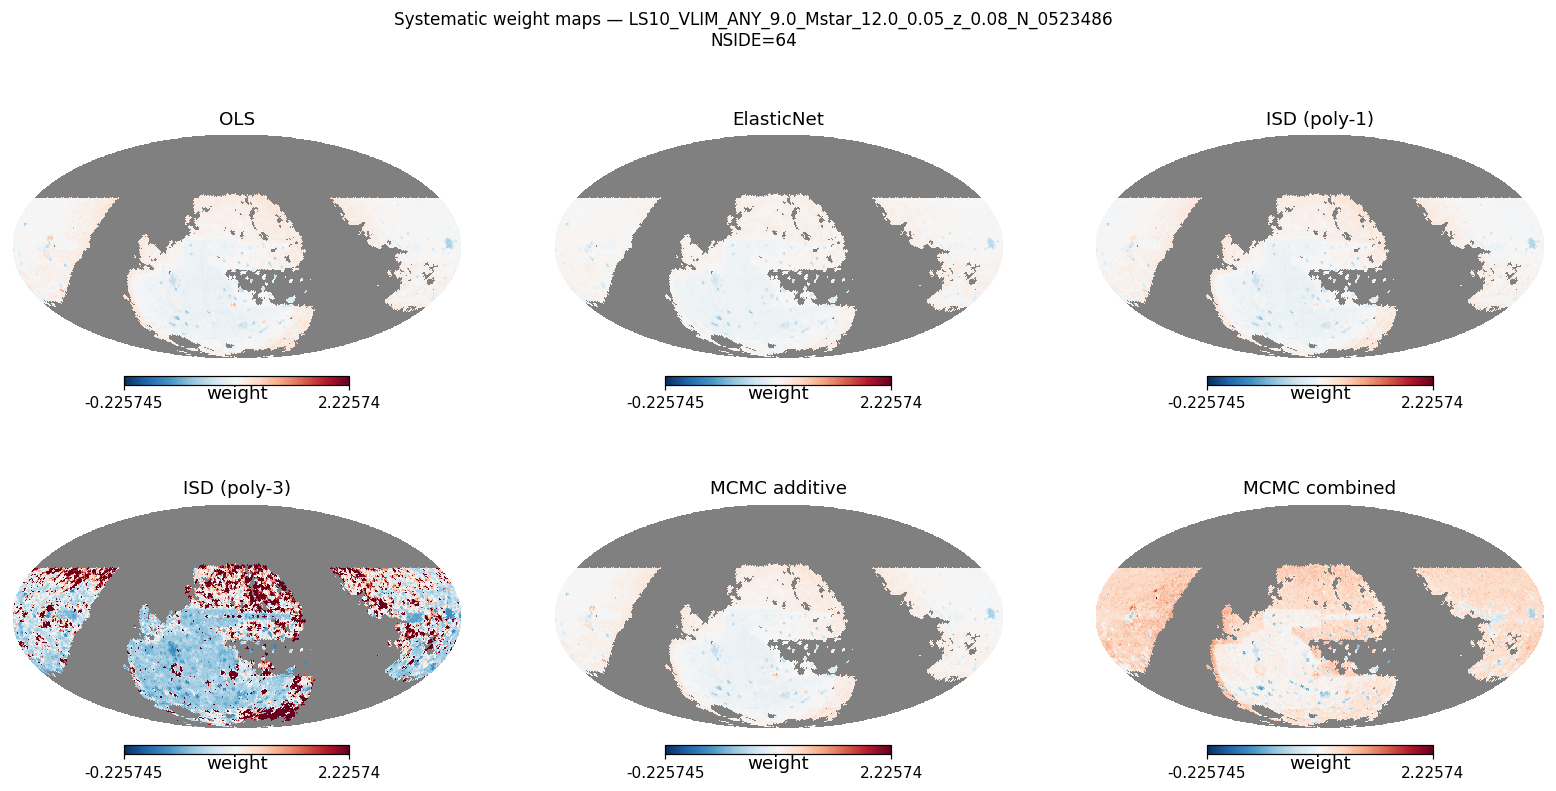
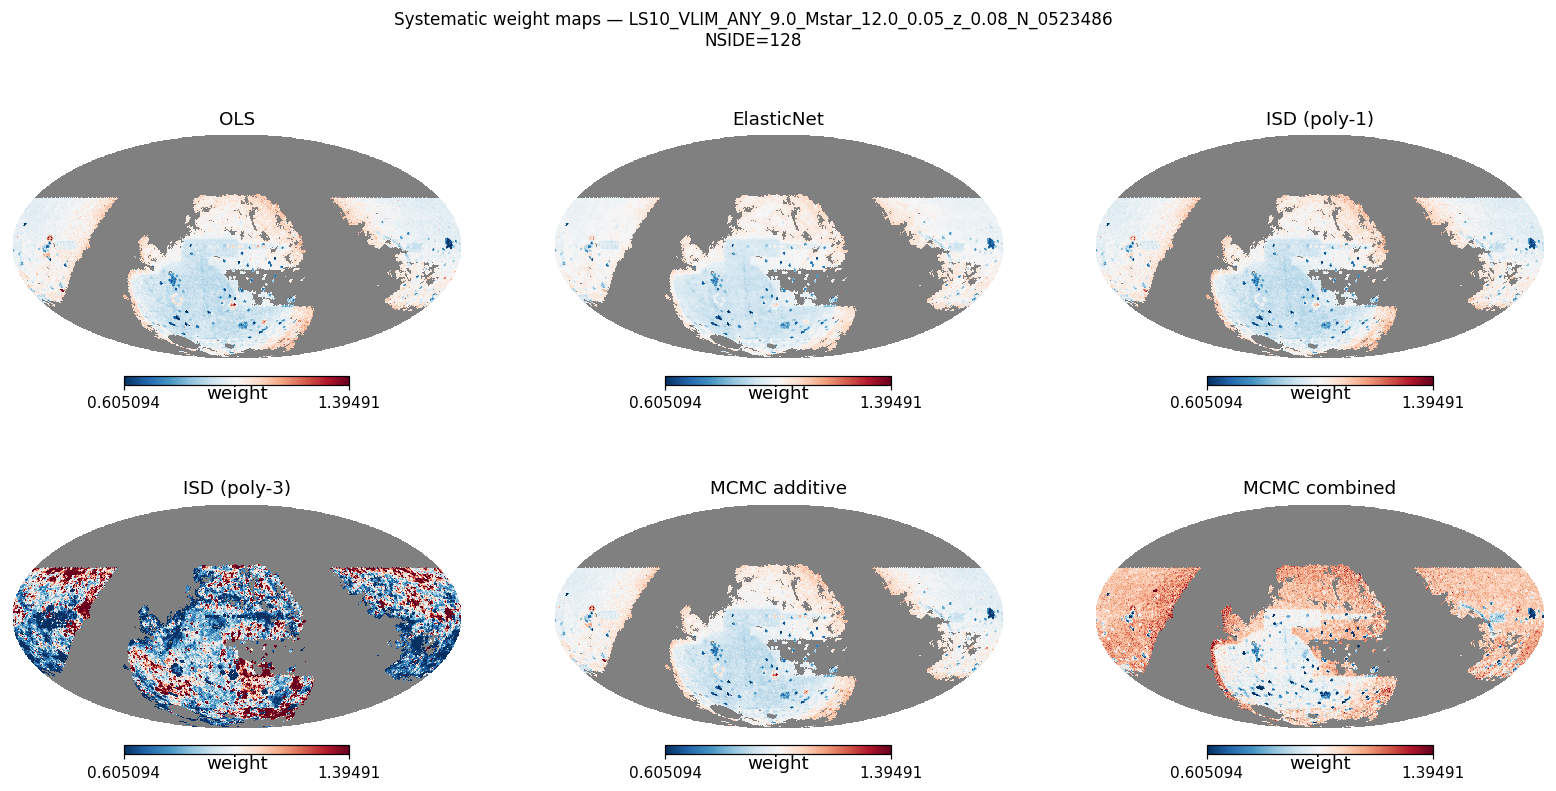
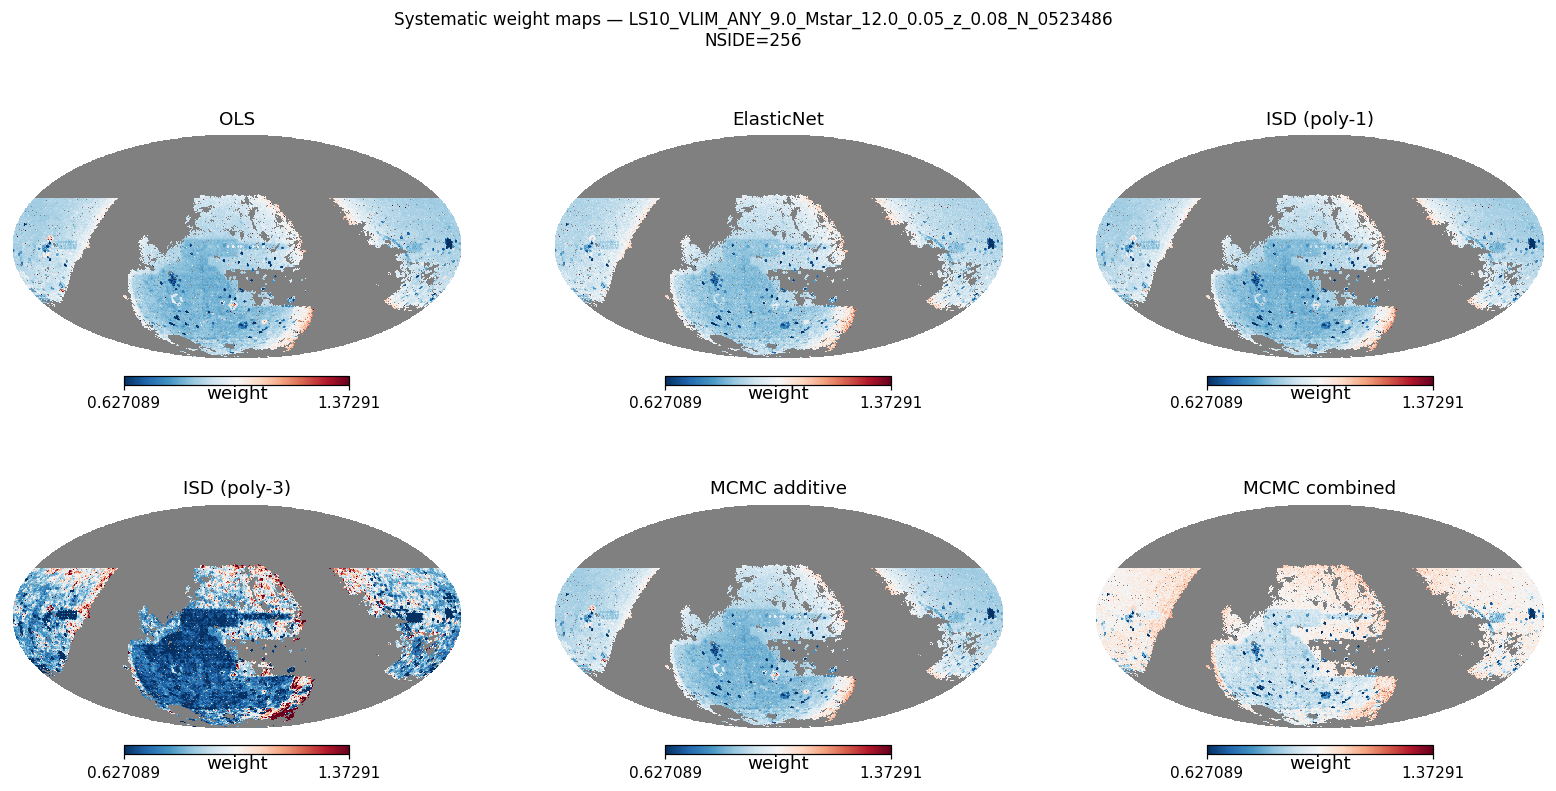
Systematic weight maps
Mollweide weight maps — all six methods
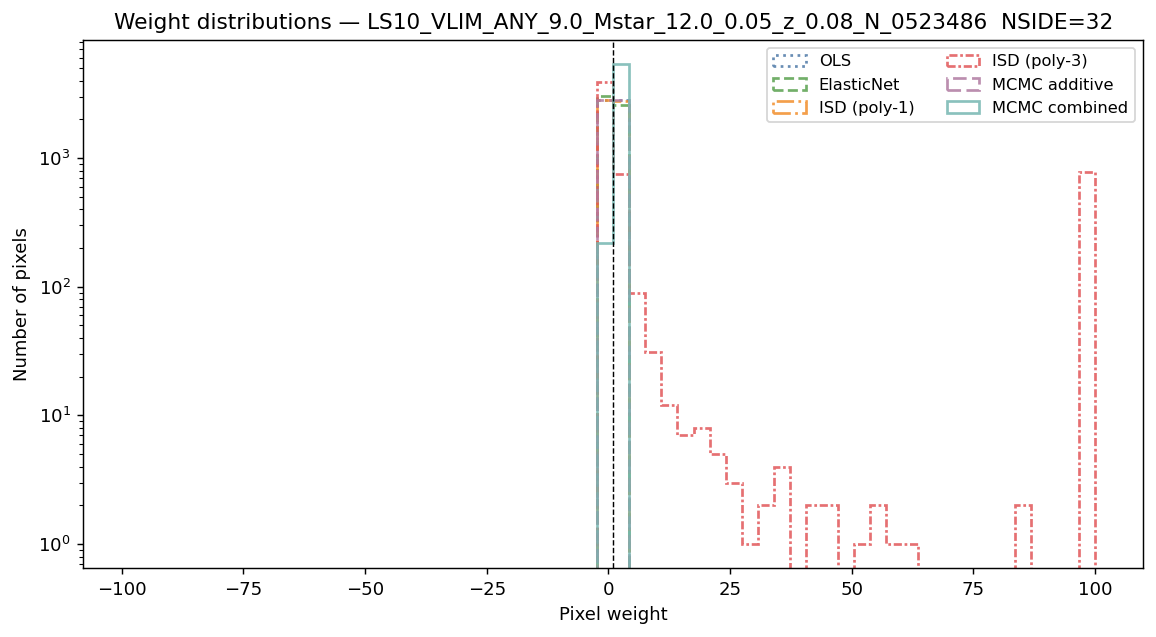
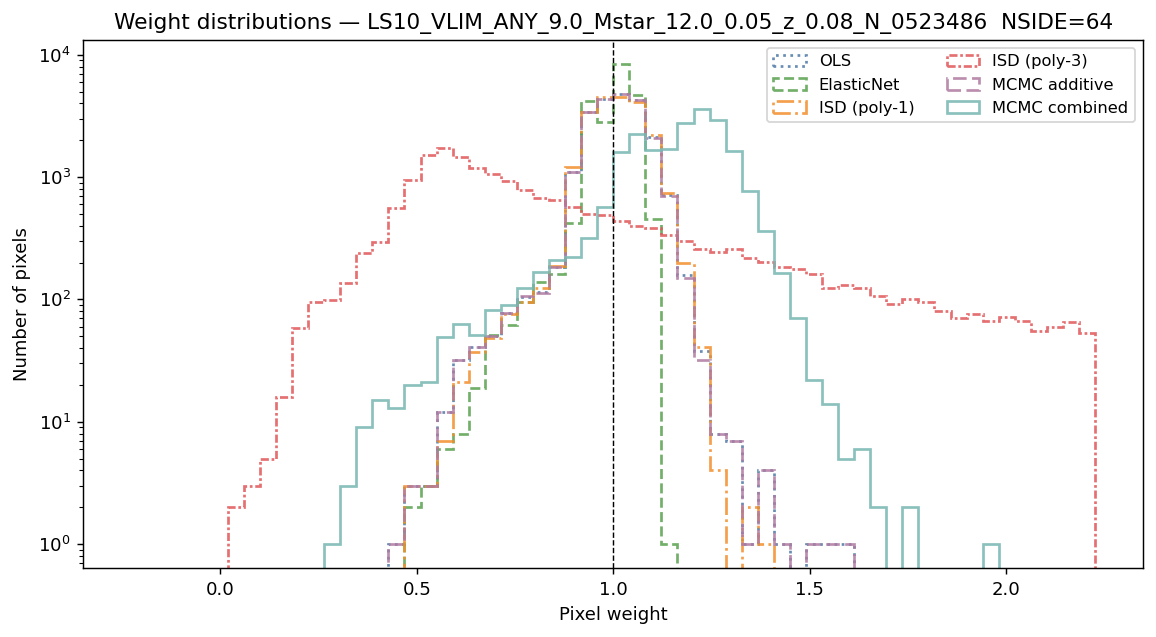
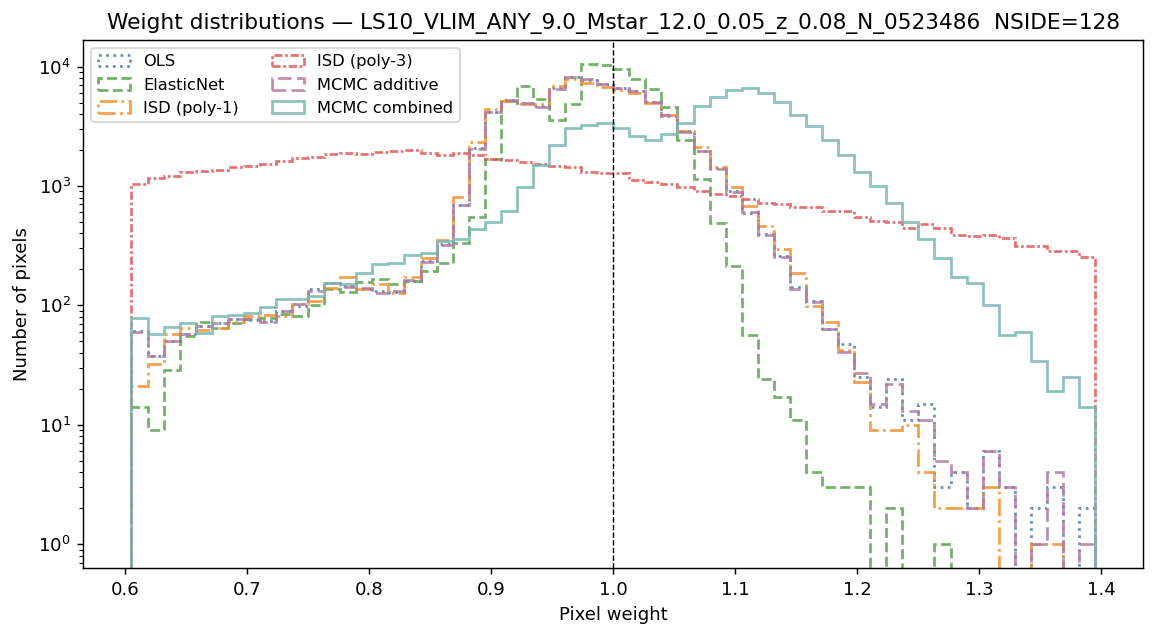
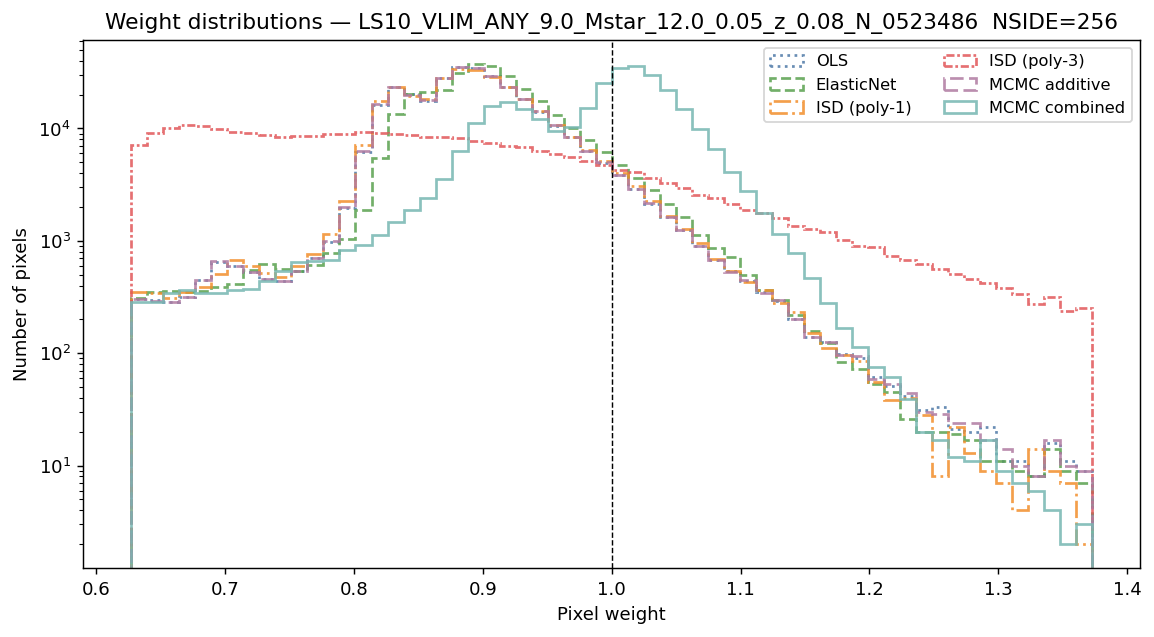
Systematic weight distributions
Narrow peaks near 1 indicate stable weight estimates. ElasticNet weights may be exactly 1 when cross-validation selects zero amplitudes.
Per-galaxy weight distributions — all six methods
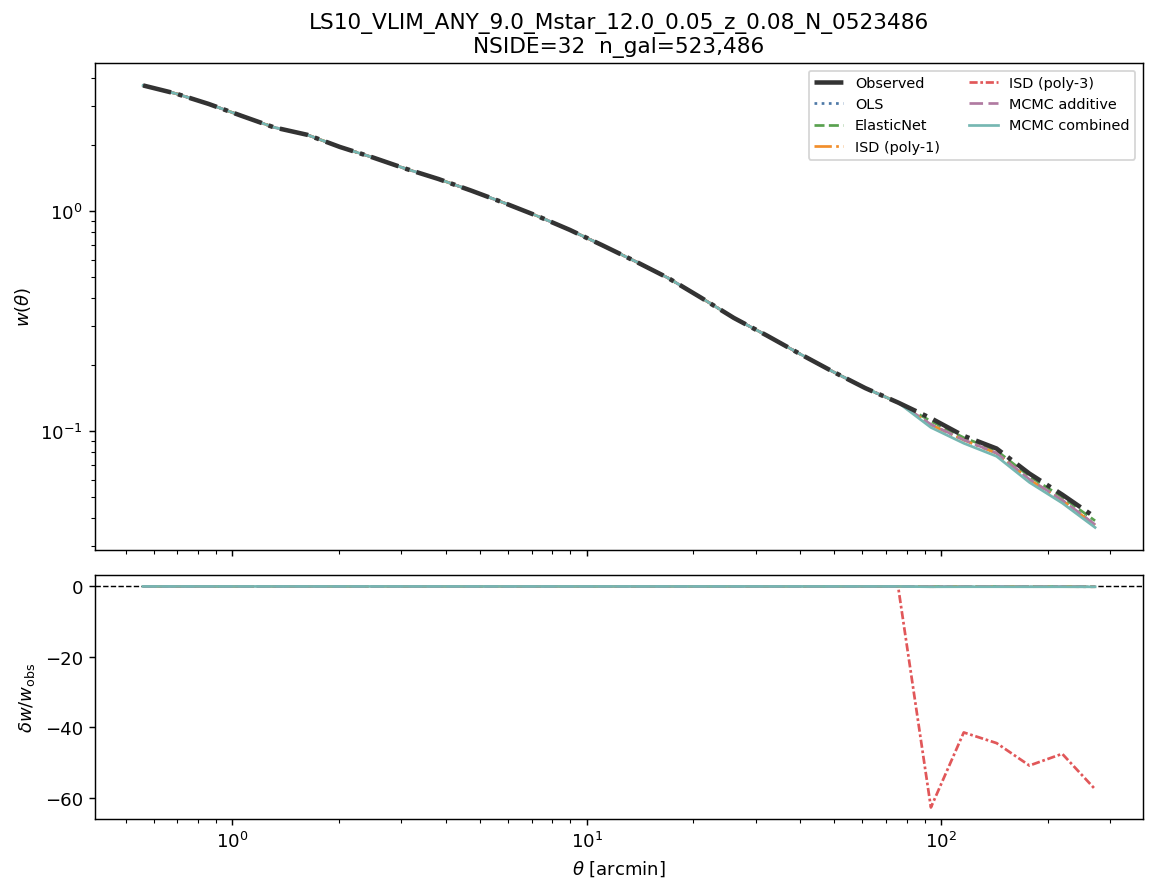
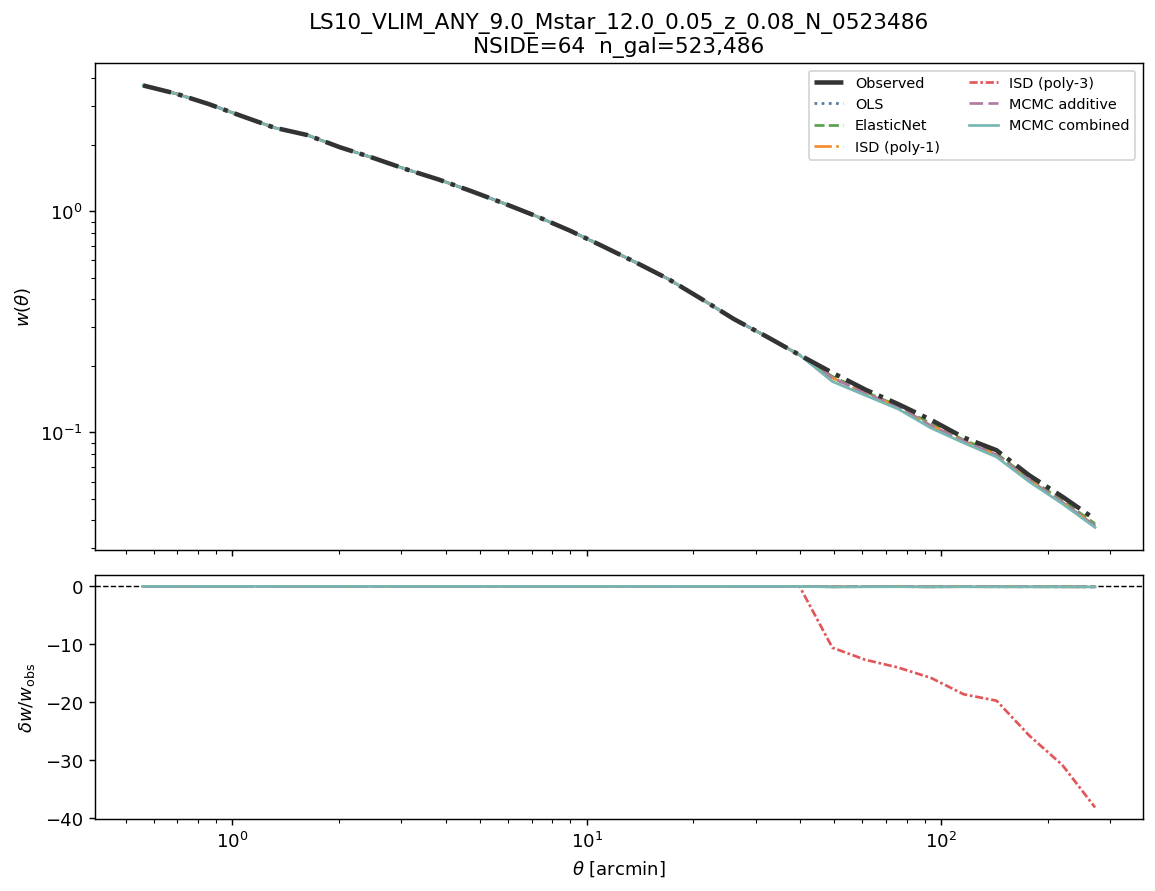
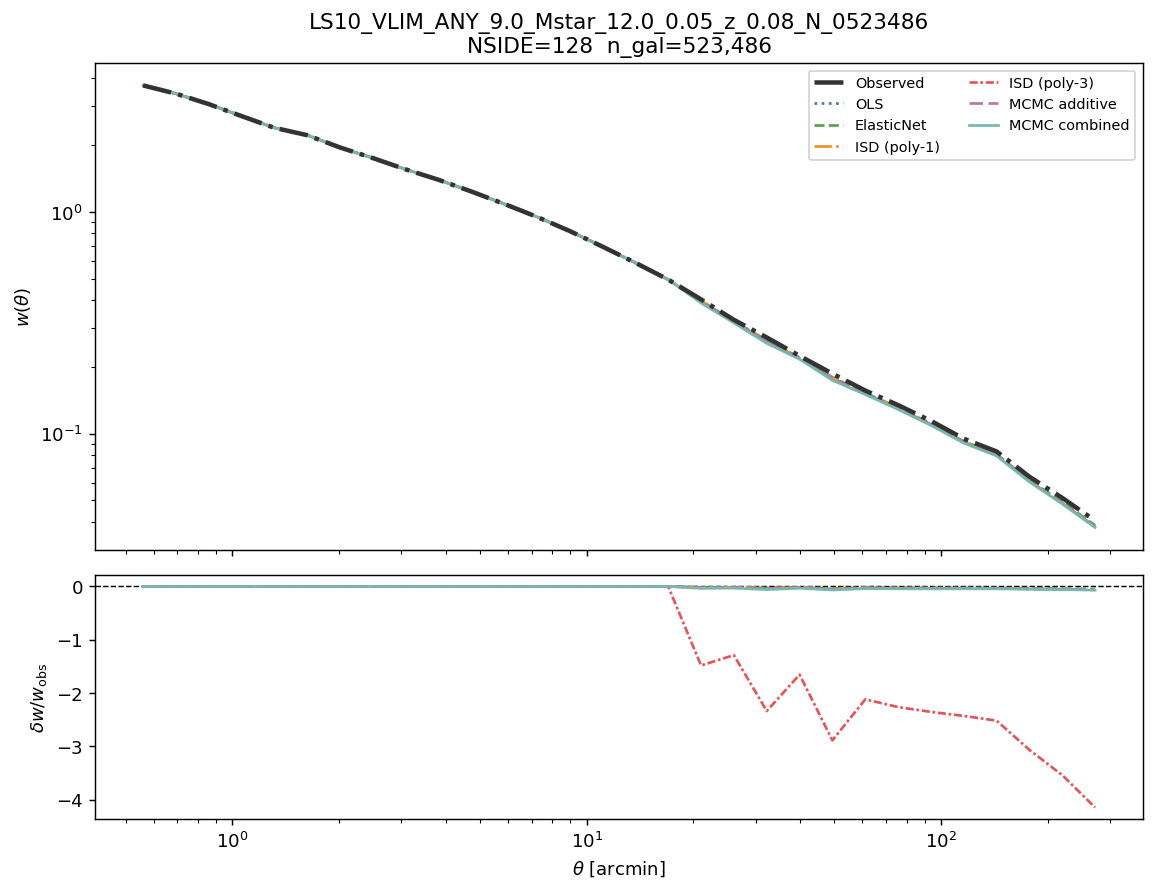
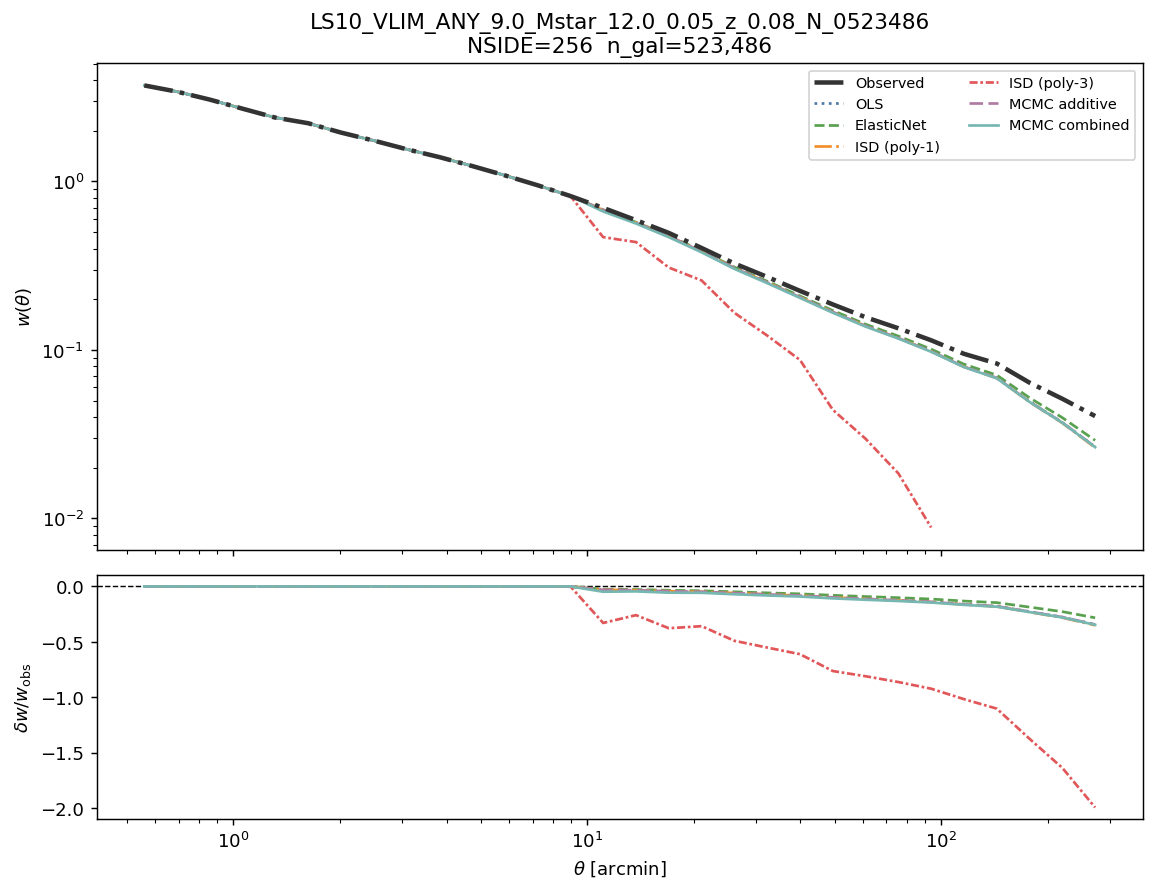
Angular clustering w(θ) before and after correction
Each panel shows the observed angular two-point correlation function (solid black) and the corrected \(w(\theta)\) for all six methods. A well-corrected sample shows suppressed excess clustering at all scales. Each panel corresponds to one map resolution.
w(θ): observed vs corrected — all six methods
Cosmological analysis verdict
Sub-degree scales (\(\theta < 30'\)): regime is strongly systematics-dominated (\(\delta w/w \approx -7.2\%\) at 30 arcmin).
Without correction: not suitable without correction.
After correction: suitable after applying
WEIGHT_COMB.Large-angle warning (\(\theta > 2°\)): max correction 8.4% at 23 arcmin — any analysis using angular scales > 1° must apply
WEIGHT_COMB.
LRT (NSIDE 64): \(\lambda_{\rm LR} = 1489.5\) (dof = 11), p = ≈ 0 → Reject H₀ — multiplicative contamination is statistically detected.
Recommendation: use WEIGHT_COMB (WEIGHT_SYS) for all science-grade analyses.