BGS VLIM log M* ≥ 10.5, z < 0.26 — detailed systematic analysis
Intermediate-mass BGS VLIM sample (3,263,228 galaxies, z < 0.26). The LRT rejects the additive null at NSIDE 64 (\(\lambda_{\rm LR} = 69.6\)).
See also
Results: systematic weights — summary tables and figures for all nine samples.
Sample statistics
Parameter |
NSIDE 32 |
NSIDE 64 |
NSIDE 128 |
NSIDE 256 |
|---|---|---|---|---|
Stellar-mass threshold |
log M* ≥ 10.5 |
log M* ≥ 10.5 |
log M* ≥ 10.5 |
log M* ≥ 10.5 |
Redshift limit |
z < 0.26 |
z < 0.26 |
z < 0.26 |
z < 0.26 |
Ngal |
3,263,228 |
3,263,228 |
3,263,228 |
3,263,228 |
Npix (good footprint) |
5,617 |
21,675 |
84,811 |
332,982 |
Ntemplates |
11 |
11 |
11 |
11 |
MCMC walkers |
210 |
210 |
210 |
210 |
MCMC steps after burn-in |
1500 |
1500 |
1500 |
1500 |
Goodness-of-fit: \(\hat{\sigma}\) by method and resolution
The noise parameter \(\hat{\sigma}\) measures residual scatter after systematic subtraction — lower is better. Results are shown for NSIDE 32, 64, 128, and 256. ISD-3 is unavailable at NSIDE 128 and 256 (no partial files generated at those resolutions).
Method |
\(\hat{\sigma}\) (N32) |
\(\hat{\sigma}\) (N64) |
\(\hat{\sigma}\) (N128) |
\(\hat{\sigma}\) (N256) |
Notes |
|---|---|---|---|---|---|
OLS |
0.3238 |
0.3089 |
0.4477 |
0.6676 |
closed-form least-squares |
ElasticNet |
0.3252 |
0.3089 |
0.4477 |
0.6676 |
L1+L2 regularised; 3-fold CV |
ISD-1 |
0.3238 |
0.3089 |
0.4477 |
0.6677 |
iterative self-calibration; poly order 1 |
ISD-3 † |
0.6415 |
1.0787 |
0.5027 |
0.6727 |
† degree-3 polynomial; unavailable at NSIDE 128/256 |
MCMC-add |
0.3241 |
0.3089 |
0.4478 |
0.6677 |
MCMC additive; acc N32=0.388 N64=0.390 |
MCMC-comb |
0.3731 |
0.3104 |
0.4514 |
0.6593 |
MCMC combined; acc N32=0.282 N64=0.287 |
† ISD-3 uses a degree-3 polynomial expansion and is ill-conditioned with correlated templates.
Likelihood Ratio Test (additive vs combined model)
Resolution |
\(\lambda_{\rm LR}\) |
dof |
p-value |
Reject H₀ |
|---|---|---|---|---|
NSIDE 32 |
952.9 |
11 |
< 10-197 |
Yes |
NSIDE 64 |
69.6 |
11 |
1.46e-10 |
Yes |
NSIDE 128 |
233.9 |
11 |
< 10-44 |
Yes |
NSIDE 256 |
557.4 |
11 |
< 10-112 |
Yes |
MCMC acceptance fractions: NSIDE 32: add 0.388, comb 0.282 NSIDE 64: add 0.390, comb 0.287 NSIDE 128: add 0.389, comb 0.288 NSIDE 256: add 0.388, comb 0.298. Healthy range: 0.15–0.50.
Template amplitude ranking — additive model (MCMC-add, NSIDE 64)
All 11 templates sorted by absolute MCMC-add additive amplitude \(|\hat{a}_i|\). OLS shown for comparison.
Rank |
Template |
NSIDE |
\(\hat{a}_i\) (MCMC-add) |
\(\hat{a}_i\) (OLS) |
Physical meaning |
|---|---|---|---|---|---|
1 |
GAIA_nstar_faint |
64 |
+0.3550 |
+0.3571 |
GAIA faint stellar density (photometric mis-classification of faint stars as galaxies) |
2 |
GAIA_nstar_medium |
64 |
-0.2488 |
-0.2503 |
GAIA medium stellar density (crowding and deblending near bright stars) |
3 |
GAIA_phot_rp_mean_flux |
64 |
-0.0394 |
-0.0393 |
GAIA mean stellar flux in RP band (red scattered light) |
4 |
GAIA_phot_g_mean_flux |
64 |
+0.0288 |
+0.0288 |
GAIA mean stellar flux in G band (scattered-light / sky-background variations) |
5 |
LS10_GALDEPTH_R_NSIDE_0064 |
? |
+0.0143 |
+0.0144 |
LS10_GALDEPTH_R_NSIDE_0064 |
6 |
GAIA_phot_bp_mean_flux |
64 |
-0.0138 |
-0.0140 |
GAIA mean stellar flux in BP band (blue scattered light) |
7 |
LS10_EBV_NSIDE_0064 |
? |
-0.0101 |
-0.0100 |
LS10_EBV_NSIDE_0064 |
8 |
LS10_NOBS_R_NSIDE_0064 |
? |
-0.0069 |
-0.0070 |
LS10_NOBS_R_NSIDE_0064 |
9 |
LS10_GALDEPTH_G_NSIDE_0064 |
? |
-0.0061 |
-0.0060 |
LS10_GALDEPTH_G_NSIDE_0064 |
10 |
LS10_PSFSIZE_R_NSIDE_0064 |
? |
-0.0043 |
-0.0043 |
LS10_PSFSIZE_R_NSIDE_0064 |
11 |
LS10_GALDEPTH_Z_NSIDE_0064 |
? |
+0.0025 |
+0.0024 |
LS10_GALDEPTH_Z_NSIDE_0064 |
Template amplitude ranking — multiplicative model (MCMC-comb, NSIDE 64)
All 11 templates sorted by absolute MCMC-comb multiplicative amplitude \(|\hat{b}_i|\).
Rank |
Template |
NSIDE |
\(\hat{b}_i\) (MCMC-comb) |
Physical meaning |
|---|---|---|---|---|
1 |
GAIA_nstar_faint |
64 |
+0.1317 |
GAIA faint stellar density (photometric mis-classification of faint stars as galaxies) |
2 |
GAIA_nstar_medium |
64 |
-0.0659 |
GAIA medium stellar density (crowding and deblending near bright stars) |
3 |
GAIA_phot_rp_mean_flux |
64 |
-0.0546 |
GAIA mean stellar flux in RP band (red scattered light) |
4 |
LS10_EBV_NSIDE_0064 |
? |
+0.0254 |
LS10_EBV_NSIDE_0064 |
5 |
LS10_GALDEPTH_R_NSIDE_0064 |
? |
+0.0227 |
LS10_GALDEPTH_R_NSIDE_0064 |
6 |
LS10_GALDEPTH_G_NSIDE_0064 |
? |
-0.0166 |
LS10_GALDEPTH_G_NSIDE_0064 |
7 |
GAIA_phot_g_mean_flux |
64 |
+0.0120 |
GAIA mean stellar flux in G band (scattered-light / sky-background variations) |
8 |
LS10_NOBS_R_NSIDE_0064 |
? |
+0.0119 |
LS10_NOBS_R_NSIDE_0064 |
9 |
GAIA_phot_bp_mean_flux |
64 |
+0.0100 |
GAIA mean stellar flux in BP band (blue scattered light) |
10 |
LS10_GALDEPTH_Z_NSIDE_0064 |
? |
-0.0045 |
LS10_GALDEPTH_Z_NSIDE_0064 |
11 |
LS10_PSFSIZE_R_NSIDE_0064 |
? |
+0.0044 |
LS10_PSFSIZE_R_NSIDE_0064 |
Per-galaxy weight statistics (NSIDE 64)
From the *_NSIDE0064_WEIGHTS.fits file. Mean ≈ 1 and small std indicate a well-behaved weight distribution.
Method |
N |
mean |
std |
p1 |
p5 |
p50 |
p95 |
p99 |
|---|---|---|---|---|---|---|---|---|
OLS |
3,263,228 |
0.9984 |
0.0315 |
0.9410 |
0.9601 |
0.9939 |
1.0538 |
1.0848 |
ElasticNet |
3,263,228 |
0.9979 |
0.0299 |
0.9423 |
0.9608 |
0.9939 |
1.0505 |
1.0801 |
ISD-1 |
3,263,228 |
0.9982 |
0.0307 |
0.9405 |
0.9603 |
0.9941 |
1.0524 |
1.0831 |
ISD-3 † |
3,263,228 |
1.6572 |
8.6699 |
0.5594 |
0.7059 |
0.8612 |
1.1419 |
2.7988 |
MCMC-add |
3,263,228 |
0.9983 |
0.0314 |
0.9411 |
0.9601 |
0.9939 |
1.0536 |
1.0846 |
MCMC-comb |
3,263,228 |
1.0075 |
0.0365 |
0.9045 |
0.9574 |
1.0097 |
1.0487 |
1.1295 |
Systematic weight maps
Mollweide weight maps — all six methods
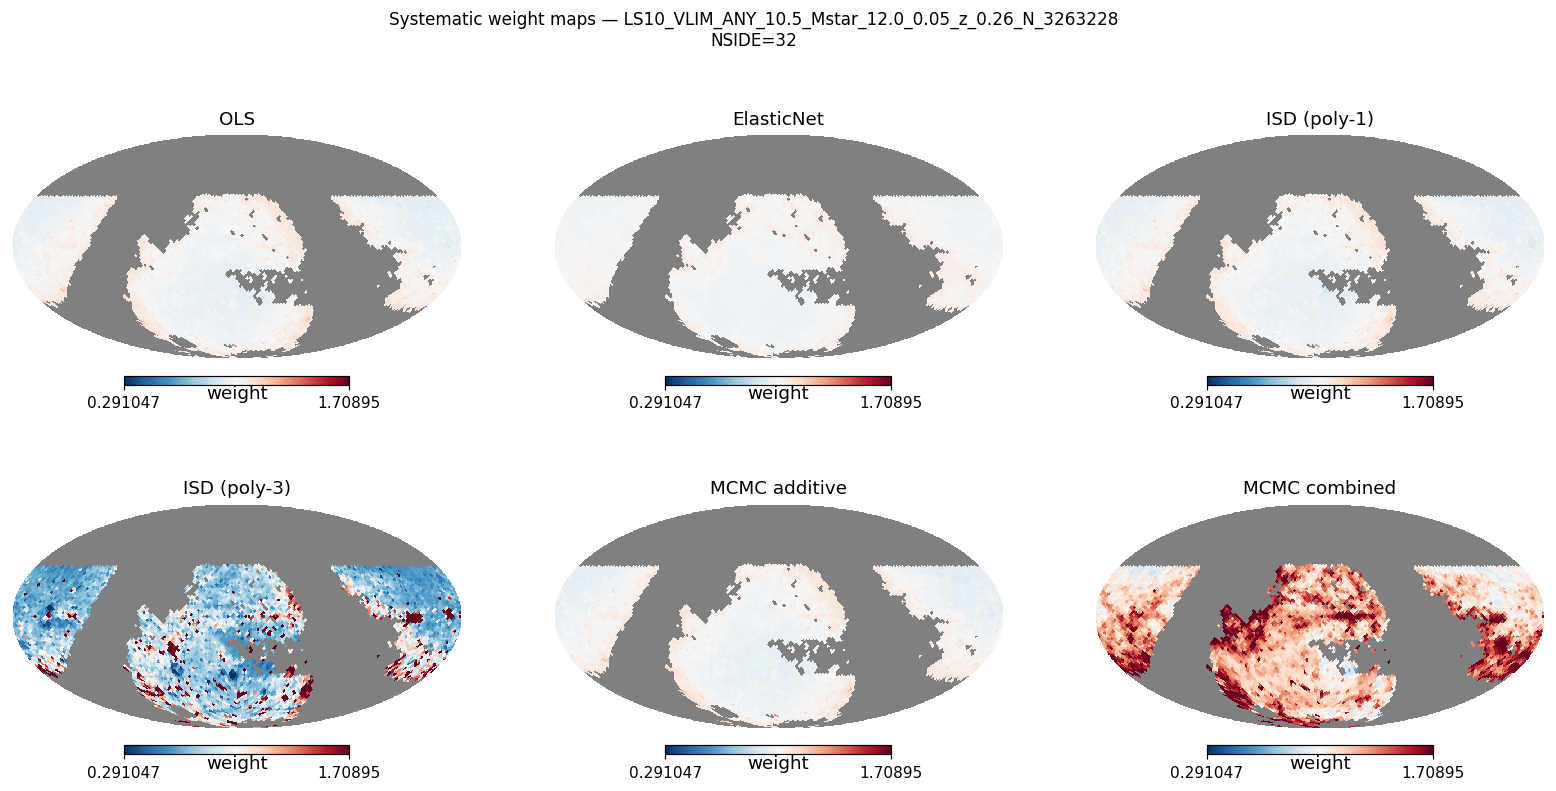
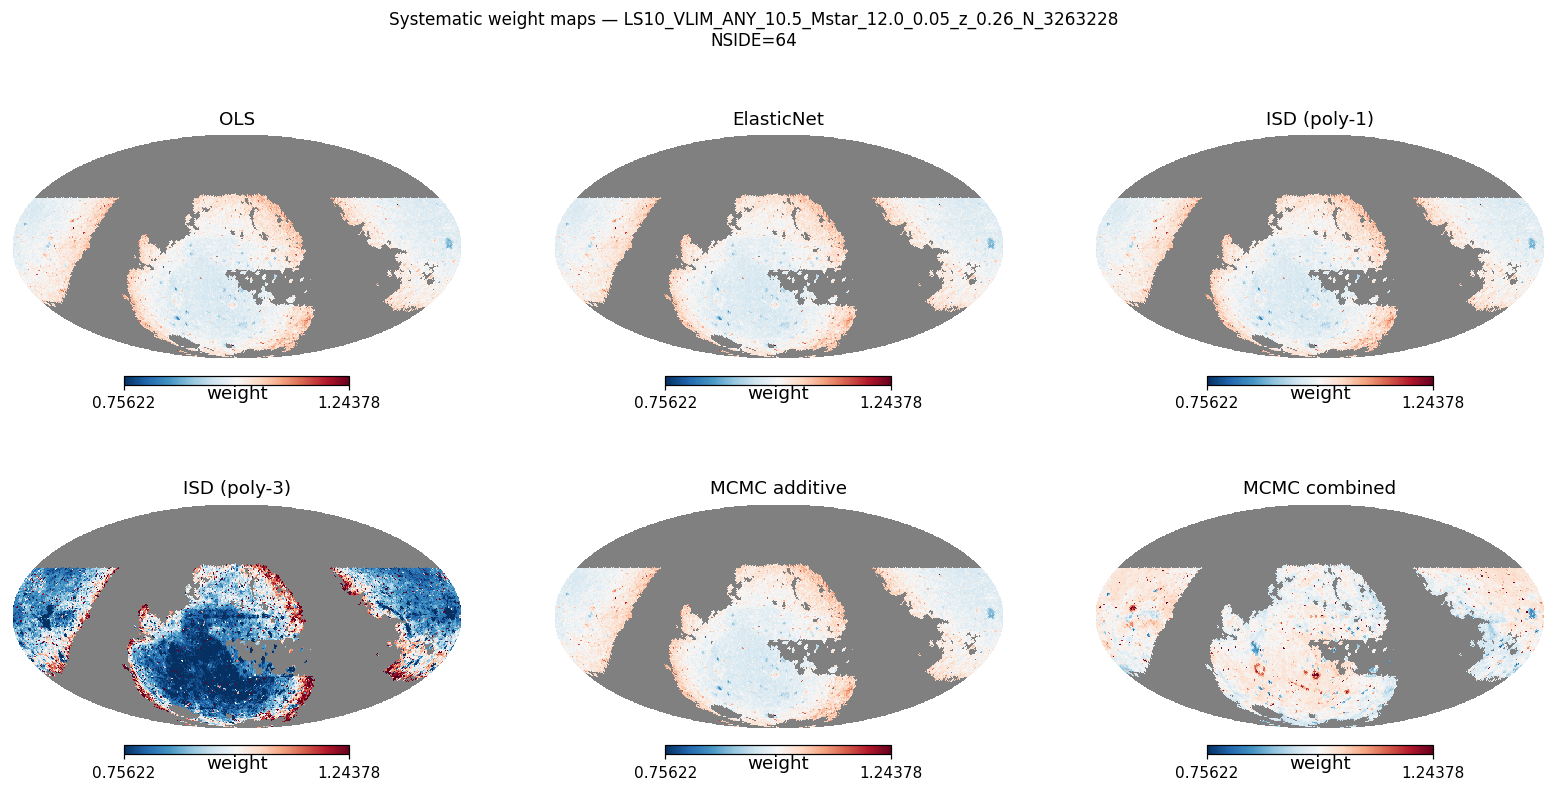
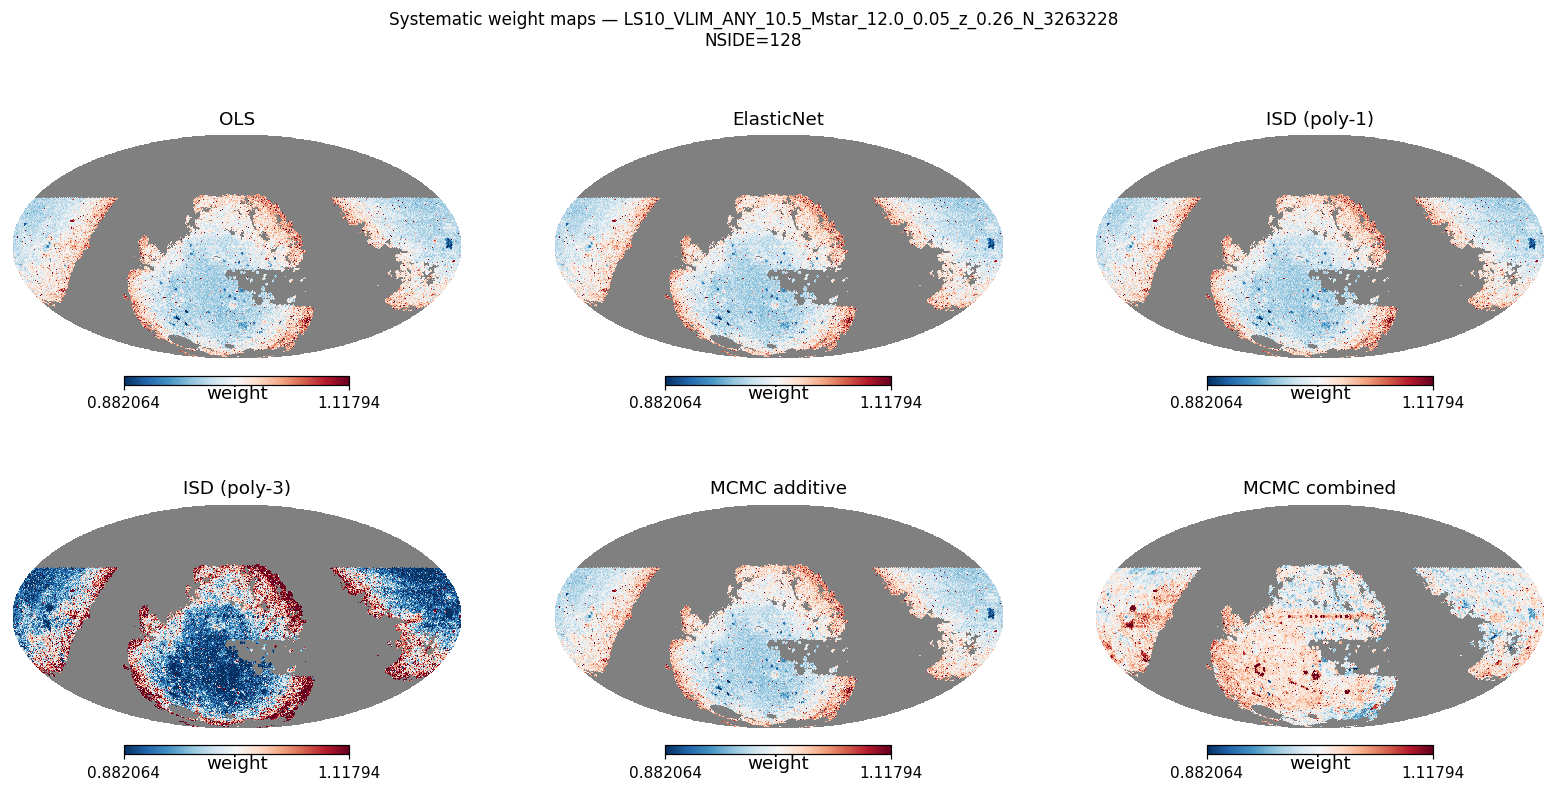
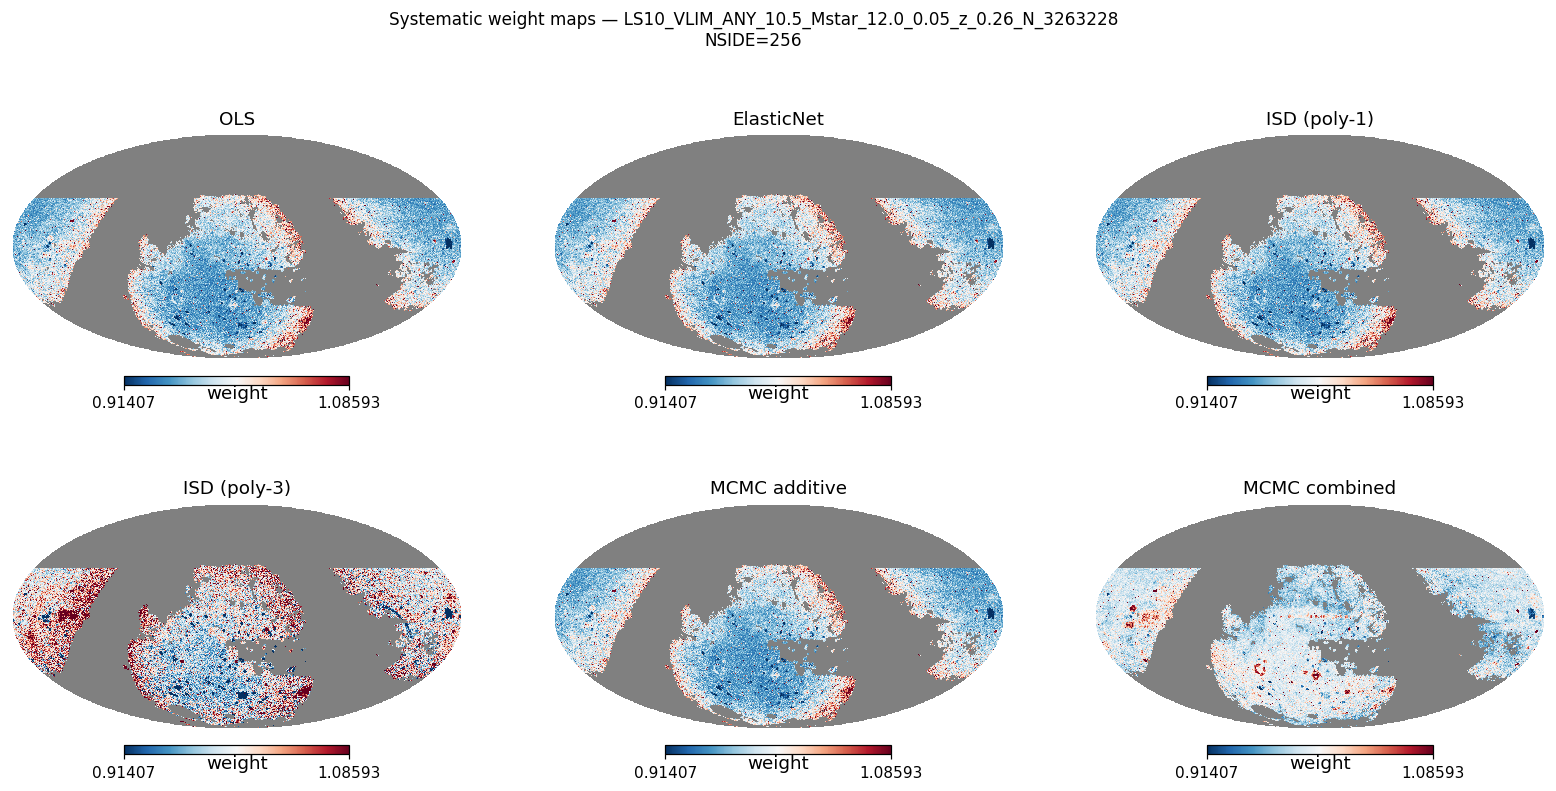
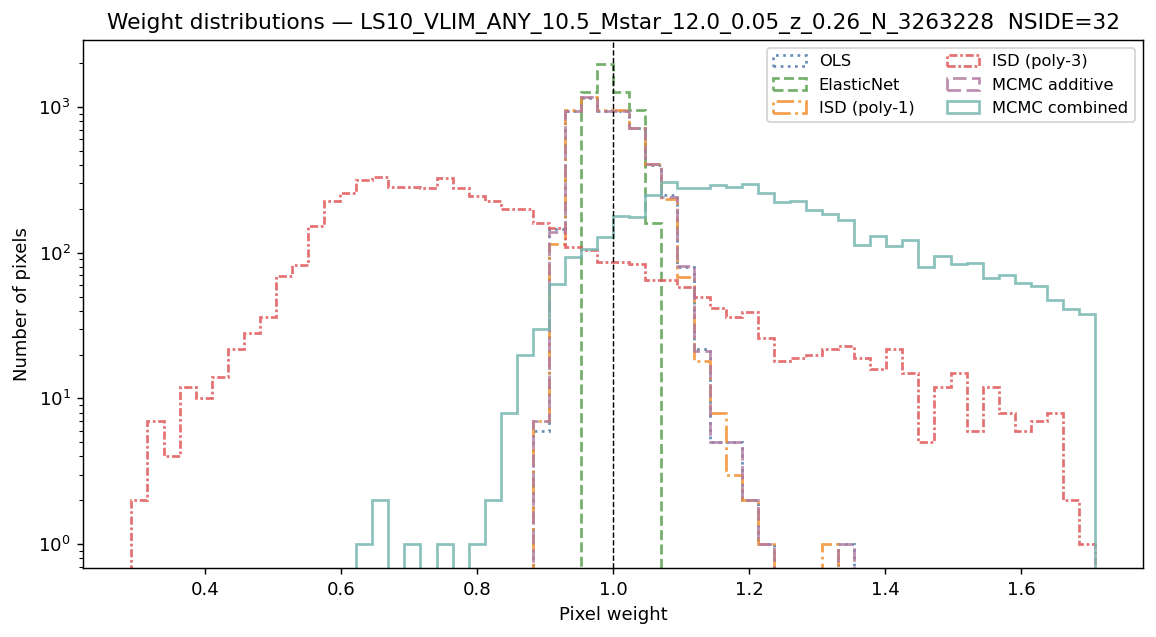
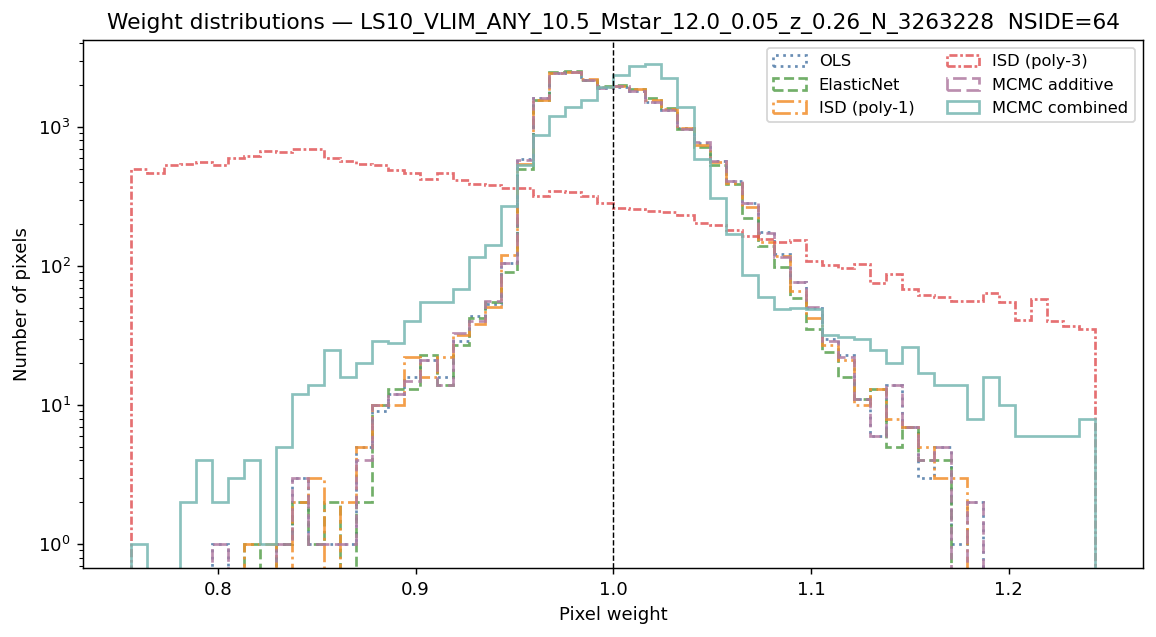
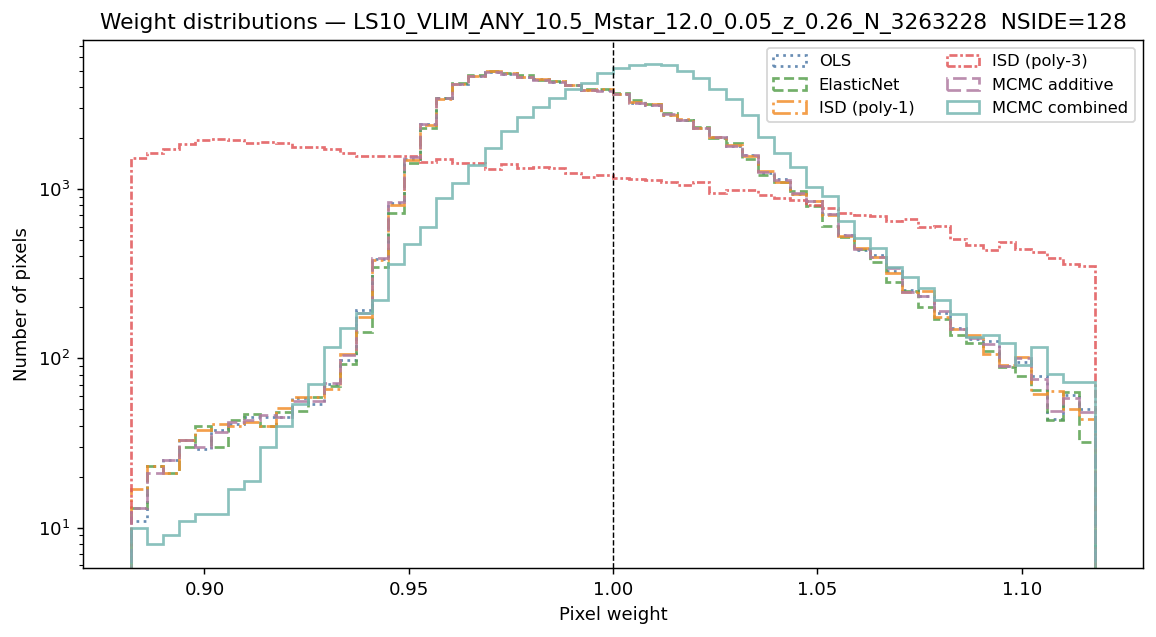
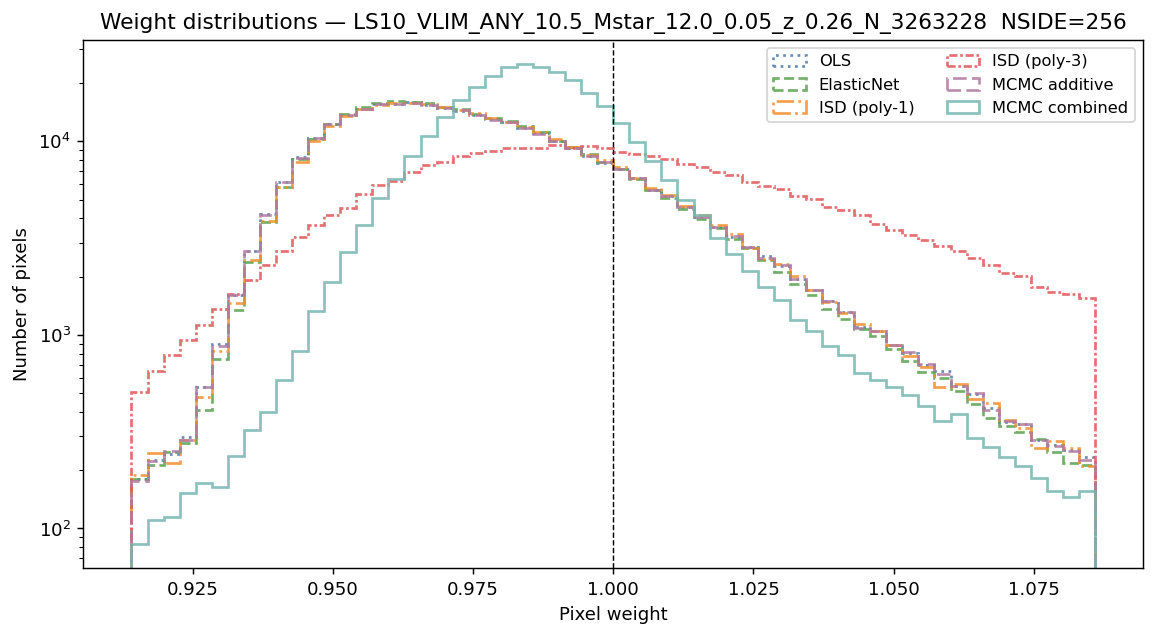
Systematic weight distributions
Narrow peaks near 1 indicate stable weight estimates. ElasticNet weights may be exactly 1 when cross-validation selects zero amplitudes.
Per-galaxy weight distributions — all six methods
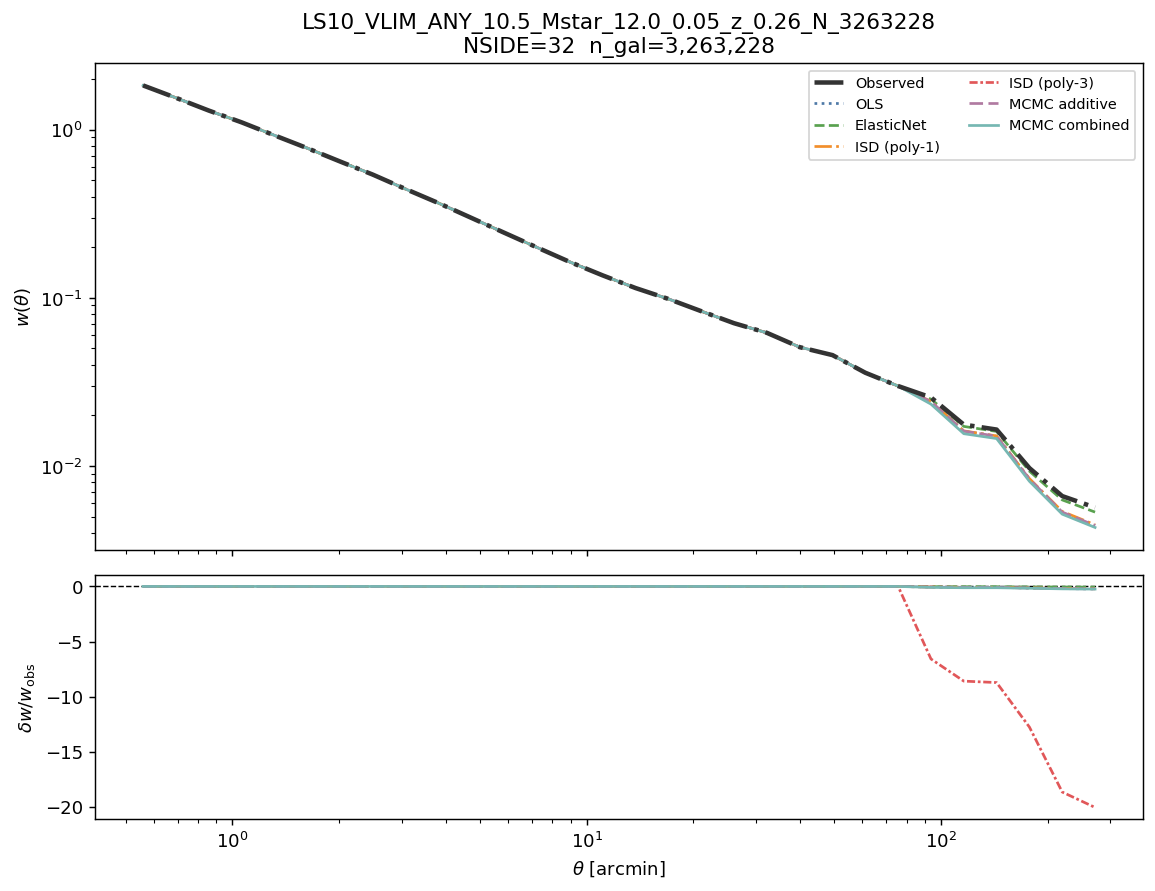
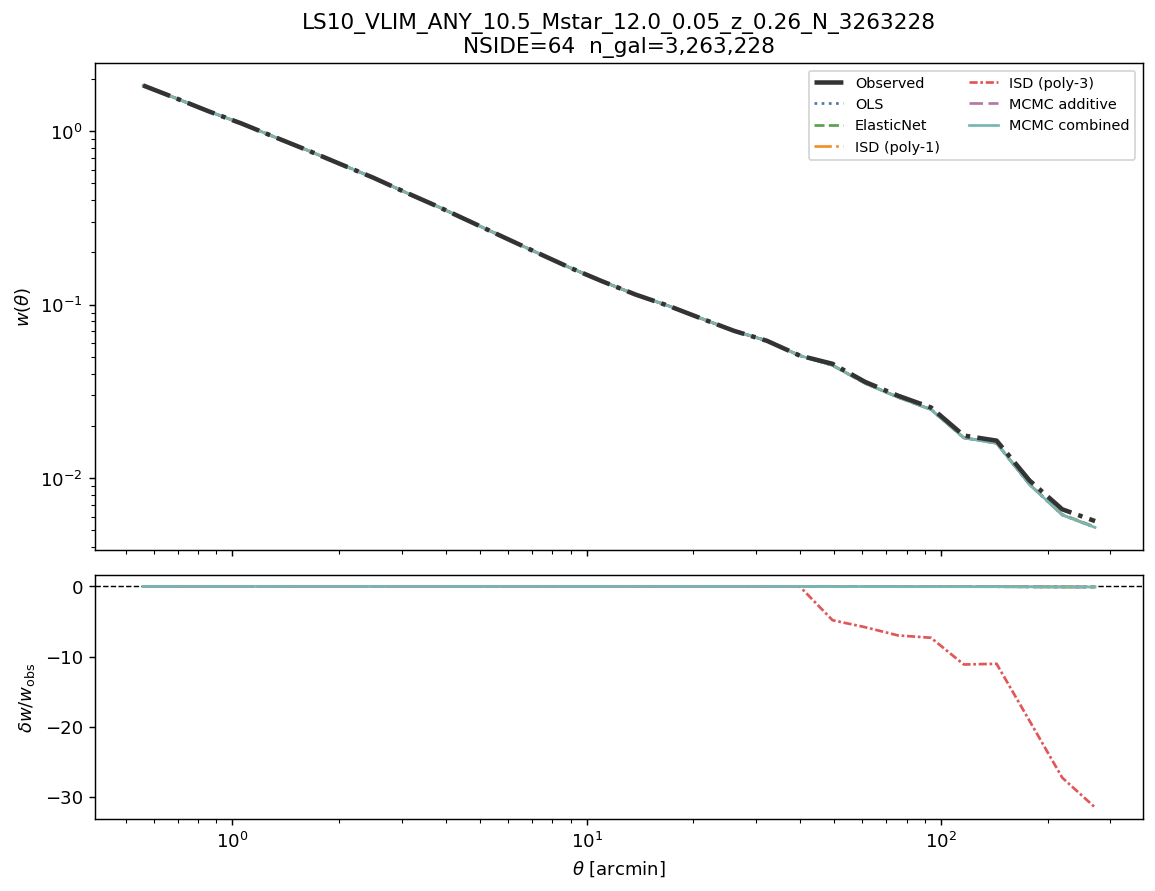
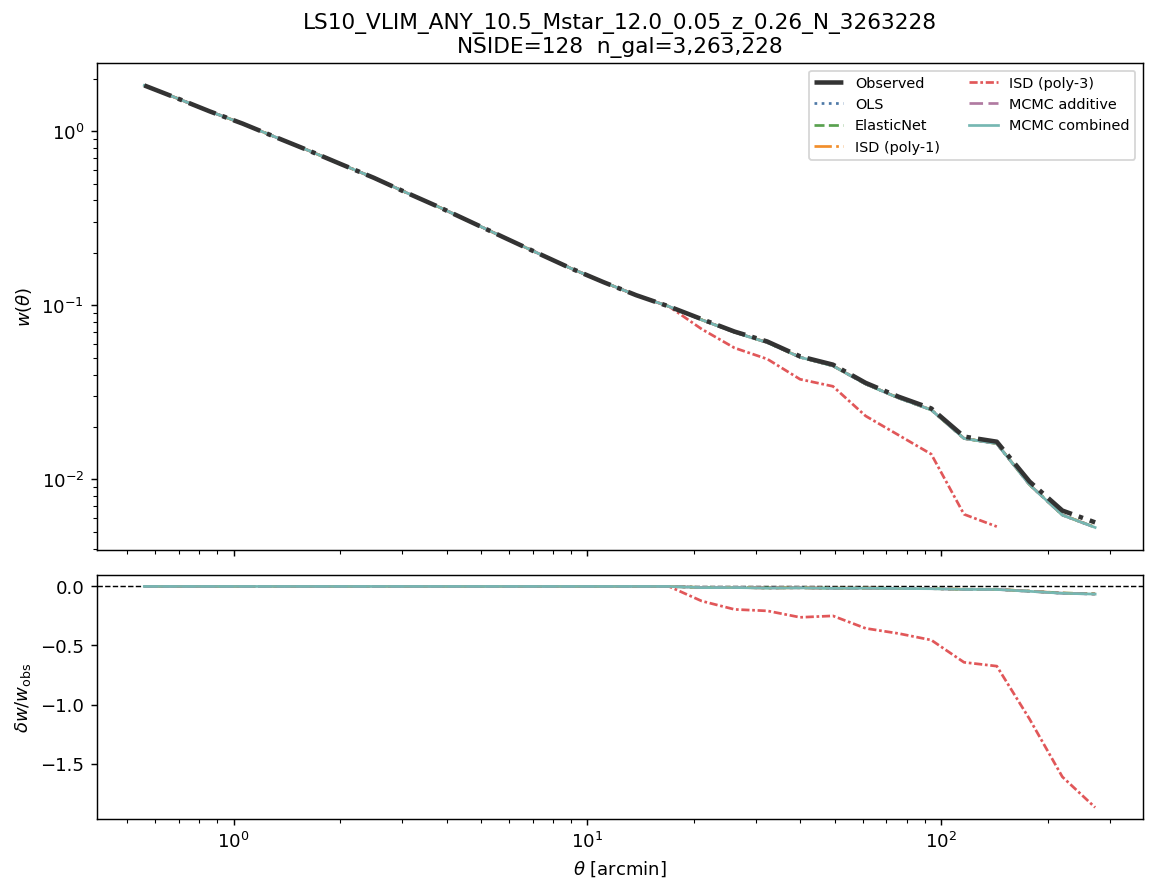
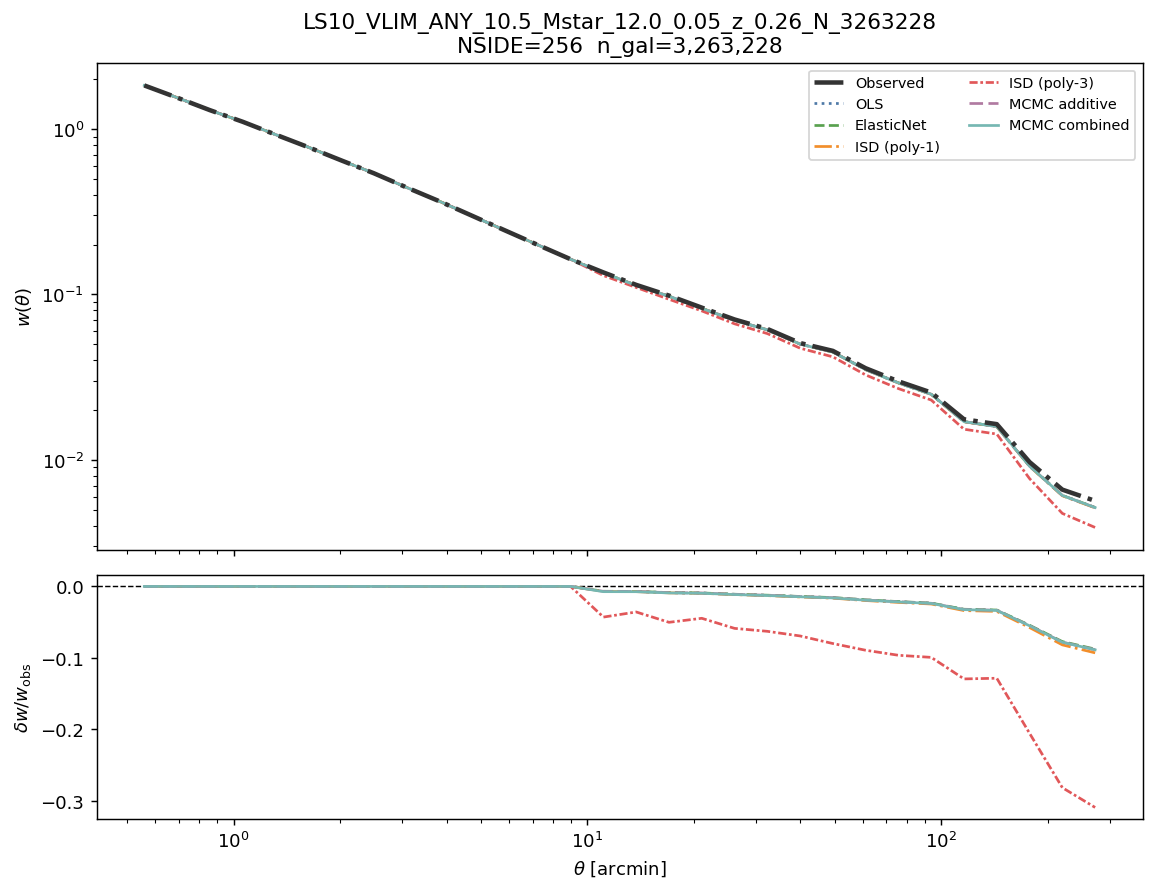
Angular clustering w(θ) before and after correction
Each panel shows the observed angular two-point correlation function (solid black) and the corrected \(w(\theta)\) for all six methods. A well-corrected sample shows suppressed excess clustering at all scales. Each panel corresponds to one map resolution.
w(θ): observed vs corrected — all six methods
Cosmological analysis verdict
Sub-degree scales: unknown (no empirical two-point measurement available).
Without correction: uncertain.
After correction: suitable after applying
WEIGHT_COMB.
LRT (NSIDE 64): \(\lambda_{\rm LR} = 69.6\) (dof = 11), p = 1.5e-10 → Reject H₀ — multiplicative contamination is statistically detected.
Recommendation: use WEIGHT_COMB (WEIGHT_SYS) for all science-grade analyses.