BGS VLIM log M* ≥ 10.25, z < 0.22 — detailed systematic analysis
Intermediate-mass BGS VLIM sample (3,308,841 galaxies, z < 0.22). The LRT rejects the additive null at NSIDE 64 (\(\lambda_{\rm LR} = 66.9\)).
See also
Results: systematic weights — summary tables and figures for all nine samples.
Sample statistics
Parameter |
NSIDE 32 |
NSIDE 64 |
NSIDE 128 |
NSIDE 256 |
|---|---|---|---|---|
Stellar-mass threshold |
log M* ≥ 10.25 |
log M* ≥ 10.25 |
log M* ≥ 10.25 |
log M* ≥ 10.25 |
Redshift limit |
z < 0.22 |
z < 0.22 |
z < 0.22 |
z < 0.22 |
Ngal |
3,308,841 |
3,308,841 |
3,308,841 |
3,308,841 |
Npix (good footprint) |
5,618 |
21,669 |
84,831 |
333,050 |
Ntemplates |
11 |
11 |
11 |
11 |
MCMC walkers |
210 |
210 |
210 |
210 |
MCMC steps after burn-in |
1500 |
1500 |
1500 |
1500 |
Goodness-of-fit: \(\hat{\sigma}\) by method and resolution
The noise parameter \(\hat{\sigma}\) measures residual scatter after systematic subtraction — lower is better. Results are shown for NSIDE 32, 64, 128, and 256. ISD-3 is unavailable at NSIDE 128 and 256 (no partial files generated at those resolutions).
Method |
\(\hat{\sigma}\) (N32) |
\(\hat{\sigma}\) (N64) |
\(\hat{\sigma}\) (N128) |
\(\hat{\sigma}\) (N256) |
Notes |
|---|---|---|---|---|---|
OLS |
0.3417 |
0.3434 |
0.4900 |
0.7212 |
closed-form least-squares |
ElasticNet |
0.3436 |
0.3434 |
0.4900 |
0.7212 |
L1+L2 regularised; 3-fold CV |
ISD-1 |
0.3417 |
0.3434 |
0.4900 |
0.7212 |
iterative self-calibration; poly order 1 |
ISD-3 † |
0.8803 |
0.9979 |
0.5192 |
0.7267 |
† degree-3 polynomial; unavailable at NSIDE 128/256 |
MCMC-add |
0.3421 |
0.3435 |
0.4900 |
0.7212 |
MCMC additive; acc N32=0.387 N64=0.389 |
MCMC-comb |
0.3903 |
0.3343 |
0.4739 |
0.6964 |
MCMC combined; acc N32=0.280 N64=0.277 |
† ISD-3 uses a degree-3 polynomial expansion and is ill-conditioned with correlated templates.
Likelihood Ratio Test (additive vs combined model)
Resolution |
\(\lambda_{\rm LR}\) |
dof |
p-value |
Reject H₀ |
|---|---|---|---|---|
NSIDE 32 |
808.3 |
11 |
< 10-166 |
Yes |
NSIDE 64 |
66.9 |
11 |
4.69e-10 |
Yes |
NSIDE 128 |
206.8 |
11 |
< 10-38 |
Yes |
NSIDE 256 |
740.9 |
11 |
< 10-152 |
Yes |
MCMC acceptance fractions: NSIDE 32: add 0.387, comb 0.280 NSIDE 64: add 0.389, comb 0.277 NSIDE 128: add 0.388, comb 0.288 NSIDE 256: add 0.388, comb 0.298. Healthy range: 0.15–0.50.
Template amplitude ranking — additive model (MCMC-add, NSIDE 64)
All 11 templates sorted by absolute MCMC-add additive amplitude \(|\hat{a}_i|\). OLS shown for comparison.
Rank |
Template |
NSIDE |
\(\hat{a}_i\) (MCMC-add) |
\(\hat{a}_i\) (OLS) |
Physical meaning |
|---|---|---|---|---|---|
1 |
GAIA_nstar_faint |
64 |
+0.3181 |
+0.3201 |
GAIA faint stellar density (photometric mis-classification of faint stars as galaxies) |
2 |
GAIA_nstar_medium |
64 |
-0.2279 |
-0.2293 |
GAIA medium stellar density (crowding and deblending near bright stars) |
3 |
GAIA_phot_rp_mean_flux |
64 |
-0.0253 |
-0.0254 |
GAIA mean stellar flux in RP band (red scattered light) |
4 |
LS10_GALDEPTH_R_NSIDE_0064 |
? |
+0.0188 |
+0.0187 |
LS10_GALDEPTH_R_NSIDE_0064 |
5 |
GAIA_phot_g_mean_flux |
64 |
+0.0116 |
+0.0120 |
GAIA mean stellar flux in G band (scattered-light / sky-background variations) |
6 |
LS10_NOBS_R_NSIDE_0064 |
? |
-0.0112 |
-0.0112 |
LS10_NOBS_R_NSIDE_0064 |
7 |
LS10_PSFSIZE_R_NSIDE_0064 |
? |
-0.0098 |
-0.0099 |
LS10_PSFSIZE_R_NSIDE_0064 |
8 |
LS10_GALDEPTH_G_NSIDE_0064 |
? |
-0.0087 |
-0.0088 |
LS10_GALDEPTH_G_NSIDE_0064 |
9 |
GAIA_phot_bp_mean_flux |
64 |
-0.0050 |
-0.0053 |
GAIA mean stellar flux in BP band (blue scattered light) |
10 |
LS10_GALDEPTH_Z_NSIDE_0064 |
? |
+0.0042 |
+0.0042 |
LS10_GALDEPTH_Z_NSIDE_0064 |
11 |
LS10_EBV_NSIDE_0064 |
? |
-0.0021 |
-0.0021 |
LS10_EBV_NSIDE_0064 |
Template amplitude ranking — multiplicative model (MCMC-comb, NSIDE 64)
All 11 templates sorted by absolute MCMC-comb multiplicative amplitude \(|\hat{b}_i|\).
Rank |
Template |
NSIDE |
\(\hat{b}_i\) (MCMC-comb) |
Physical meaning |
|---|---|---|---|---|
1 |
LS10_GALDEPTH_R_NSIDE_0064 |
? |
+0.0358 |
LS10_GALDEPTH_R_NSIDE_0064 |
2 |
LS10_EBV_NSIDE_0064 |
? |
+0.0322 |
LS10_EBV_NSIDE_0064 |
3 |
GAIA_nstar_faint |
64 |
-0.0279 |
GAIA faint stellar density (photometric mis-classification of faint stars as galaxies) |
4 |
GAIA_nstar_medium |
64 |
-0.0258 |
GAIA medium stellar density (crowding and deblending near bright stars) |
5 |
LS10_GALDEPTH_G_NSIDE_0064 |
? |
-0.0187 |
LS10_GALDEPTH_G_NSIDE_0064 |
6 |
GAIA_phot_bp_mean_flux |
64 |
+0.0163 |
GAIA mean stellar flux in BP band (blue scattered light) |
7 |
GAIA_phot_g_mean_flux |
64 |
-0.0162 |
GAIA mean stellar flux in G band (scattered-light / sky-background variations) |
8 |
GAIA_phot_rp_mean_flux |
64 |
-0.0133 |
GAIA mean stellar flux in RP band (red scattered light) |
9 |
LS10_GALDEPTH_Z_NSIDE_0064 |
? |
-0.0066 |
LS10_GALDEPTH_Z_NSIDE_0064 |
10 |
LS10_NOBS_R_NSIDE_0064 |
? |
-0.0026 |
LS10_NOBS_R_NSIDE_0064 |
11 |
LS10_PSFSIZE_R_NSIDE_0064 |
? |
-0.0009 |
LS10_PSFSIZE_R_NSIDE_0064 |
Per-galaxy weight statistics (NSIDE 64)
From the *_NSIDE0064_WEIGHTS.fits file. Mean ≈ 1 and small std indicate a well-behaved weight distribution.
Method |
N |
mean |
std |
p1 |
p5 |
p50 |
p95 |
p99 |
|---|---|---|---|---|---|---|---|---|
OLS |
3,308,841 |
0.9986 |
0.0287 |
0.9370 |
0.9640 |
0.9946 |
1.0490 |
1.0805 |
ElasticNet |
3,308,841 |
0.9984 |
0.0283 |
0.9373 |
0.9643 |
0.9946 |
1.0478 |
1.0796 |
ISD-1 |
3,308,841 |
0.9985 |
0.0288 |
0.9364 |
0.9637 |
0.9947 |
1.0489 |
1.0805 |
ISD-3 † |
3,308,841 |
1.7136 |
8.7988 |
0.4854 |
0.7402 |
0.8821 |
1.2024 |
3.8013 |
MCMC-add |
3,308,841 |
0.9985 |
0.0286 |
0.9371 |
0.9640 |
0.9946 |
1.0487 |
1.0801 |
MCMC-comb |
3,308,841 |
0.9769 |
0.0340 |
0.8758 |
0.9271 |
0.9810 |
1.0124 |
1.0743 |
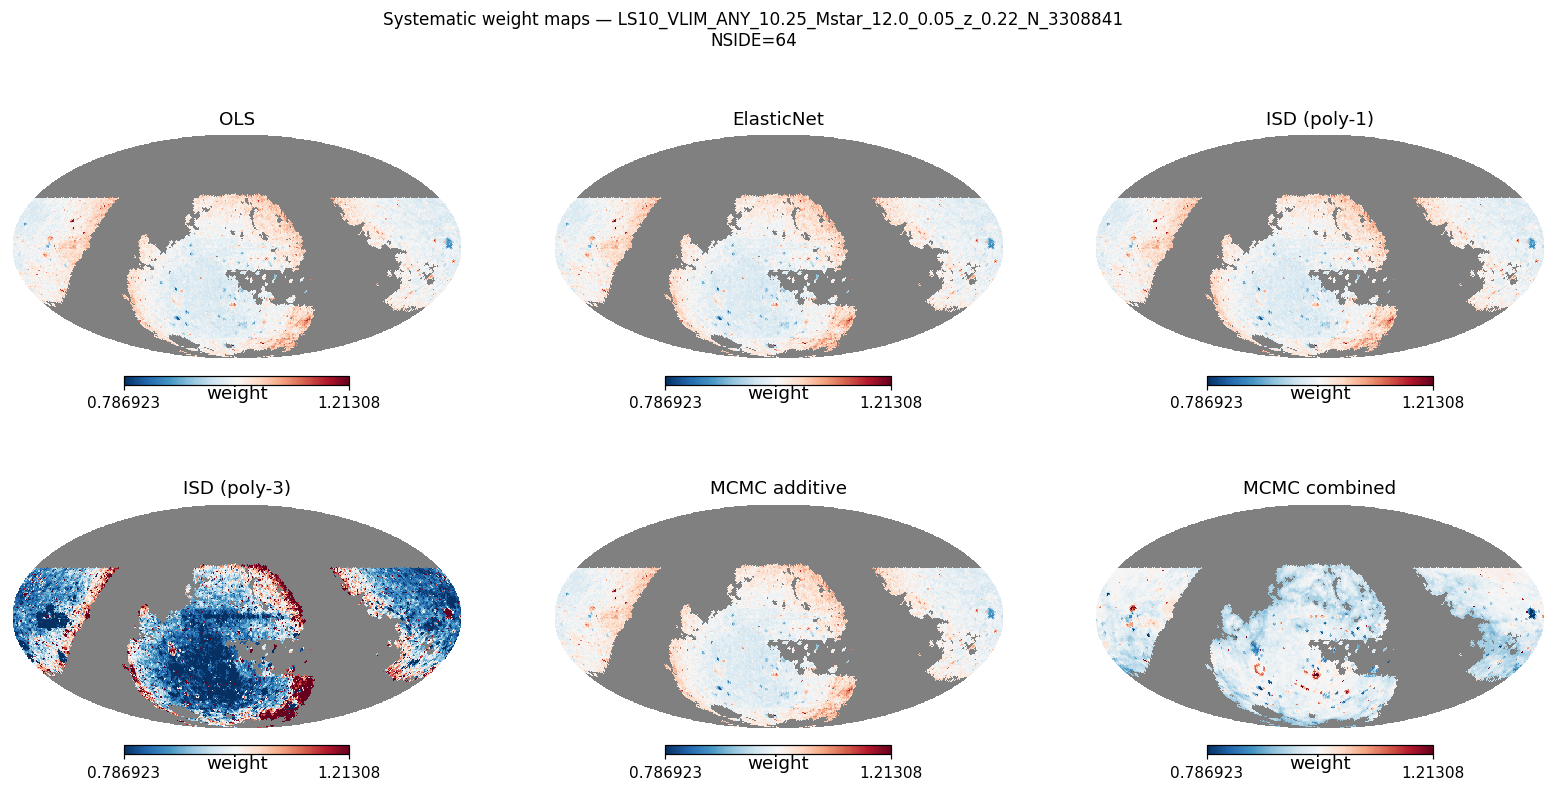
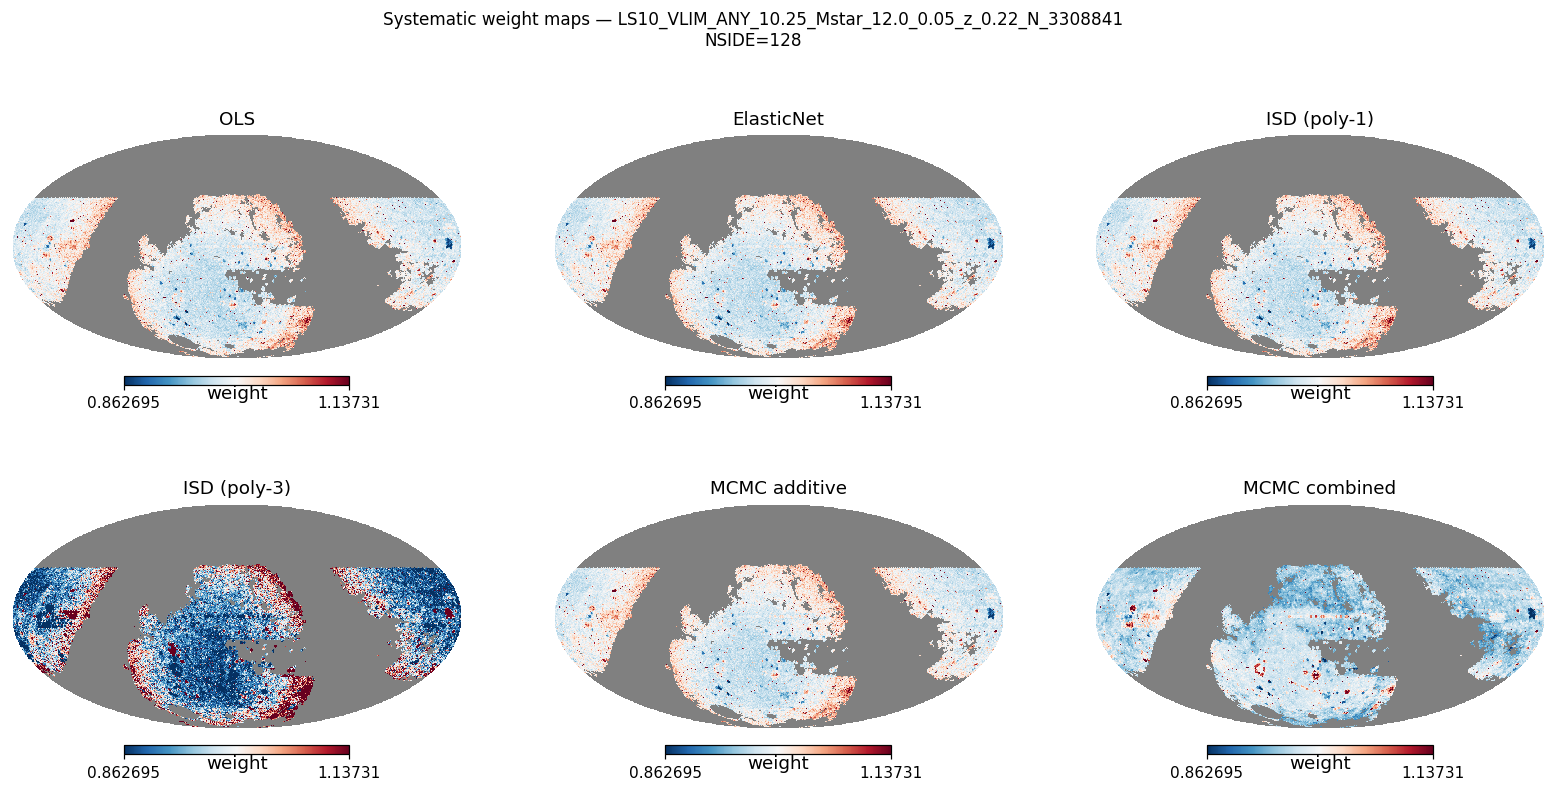
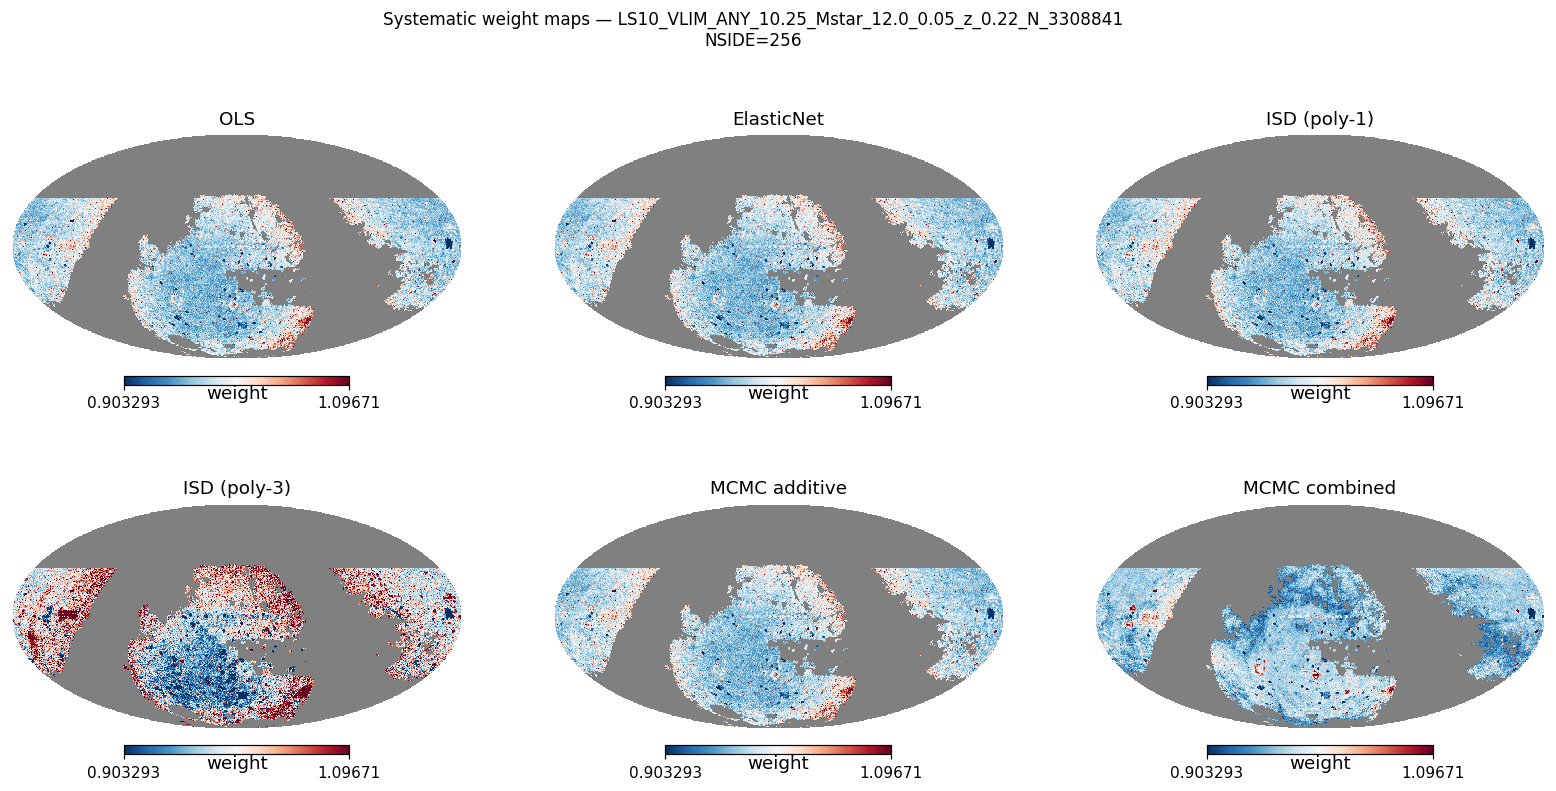
Systematic weight maps
Mollweide weight maps — all six methods
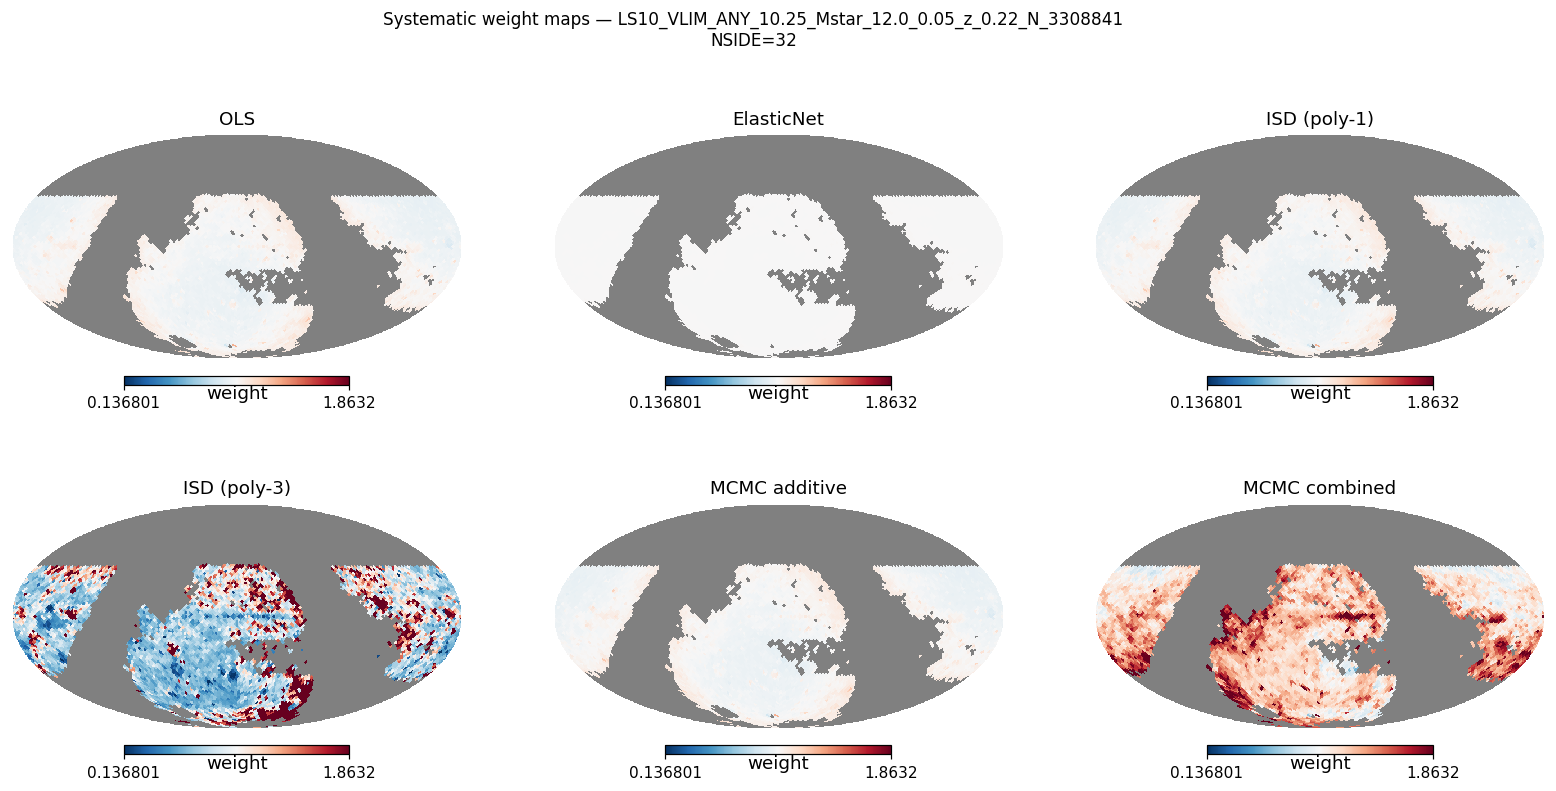
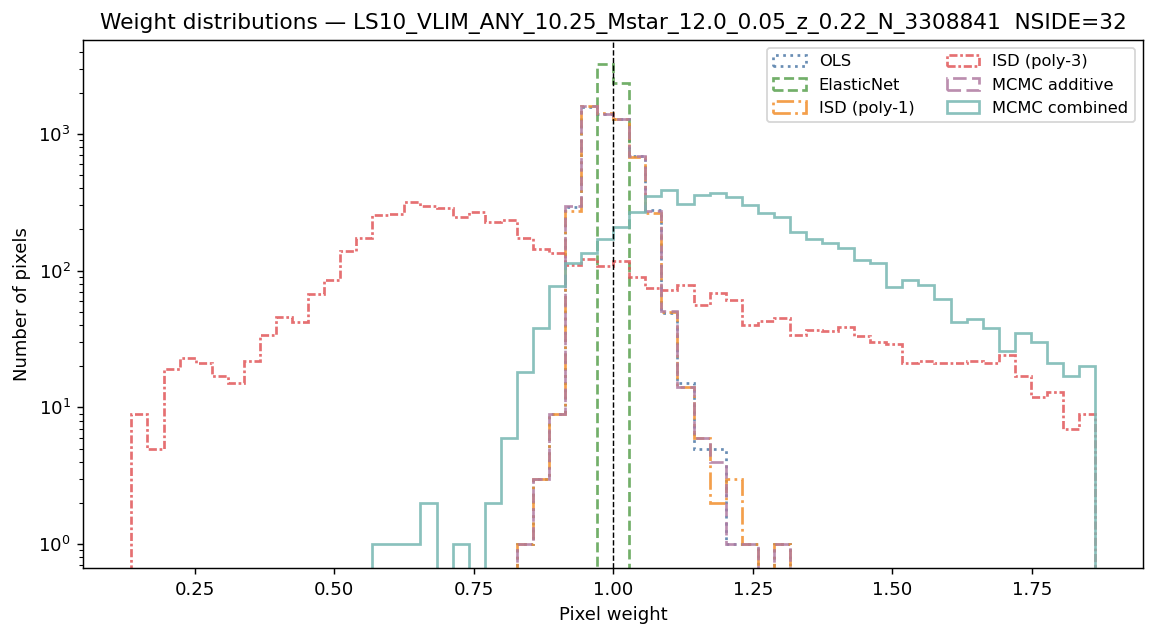
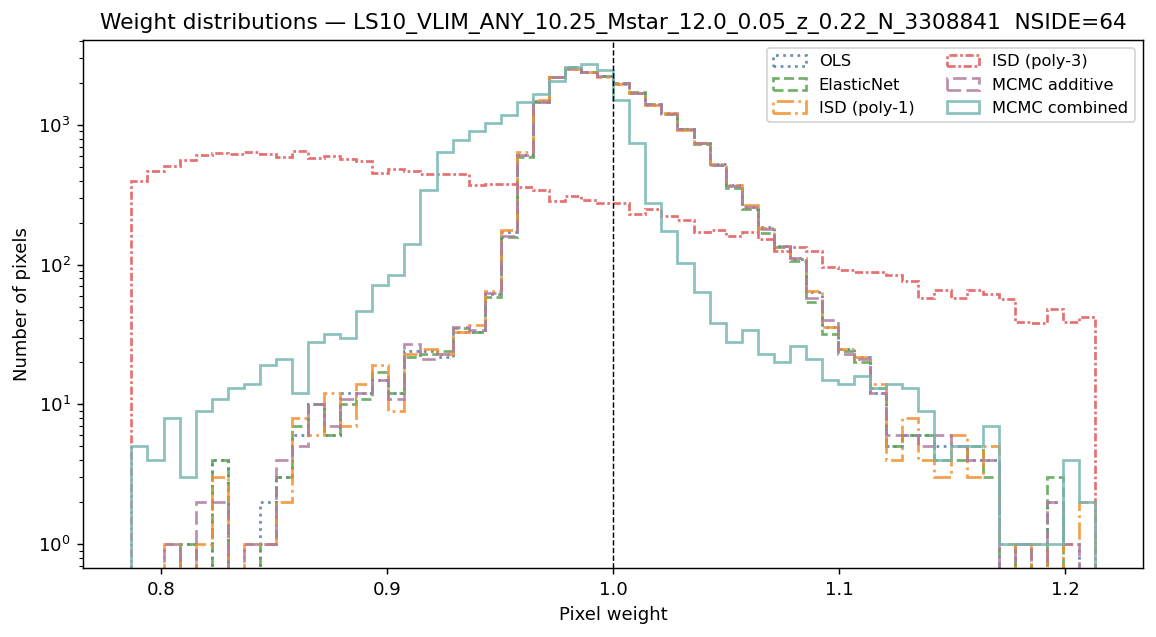
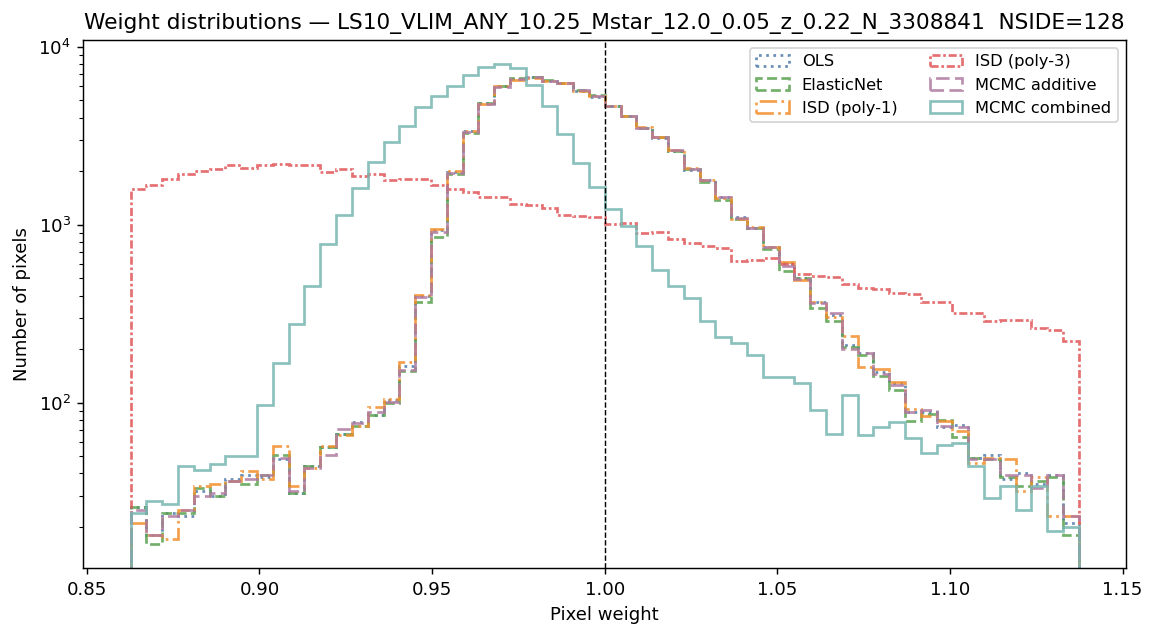
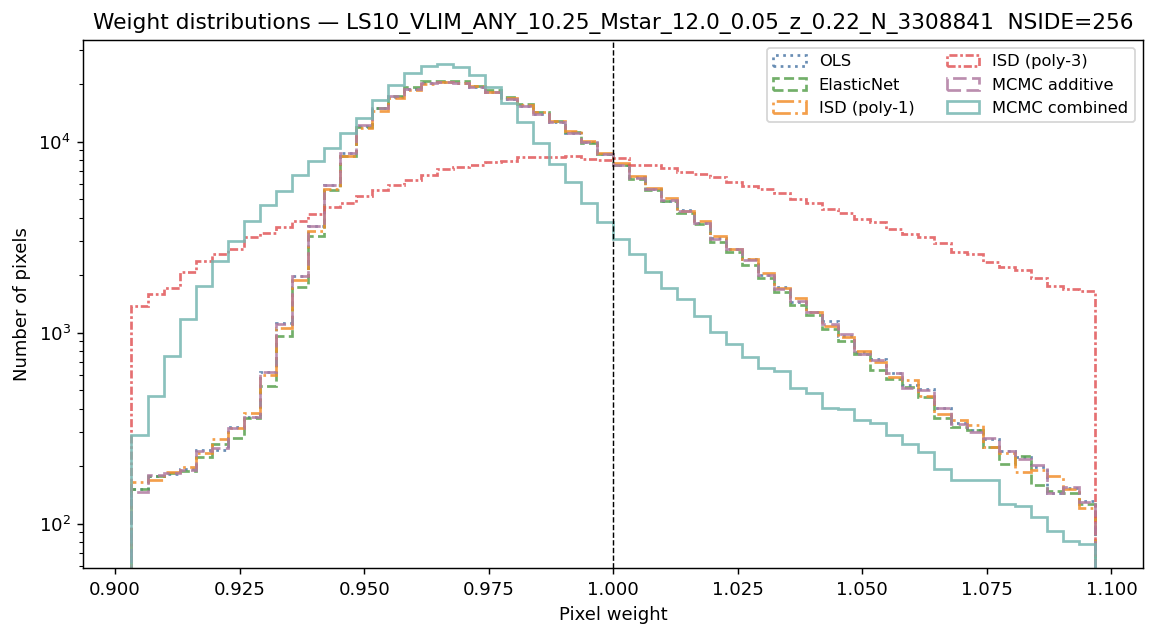
Systematic weight distributions
Narrow peaks near 1 indicate stable weight estimates. ElasticNet weights may be exactly 1 when cross-validation selects zero amplitudes.
Per-galaxy weight distributions — all six methods
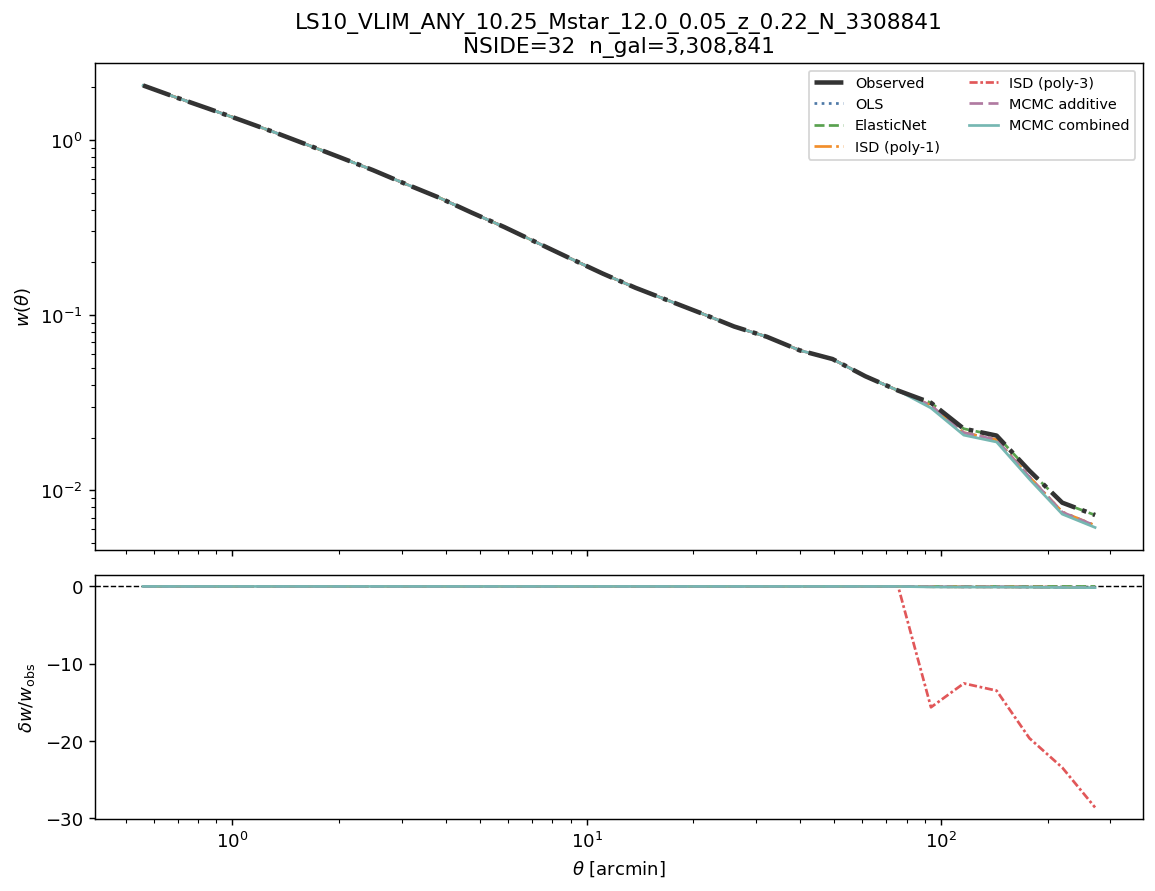
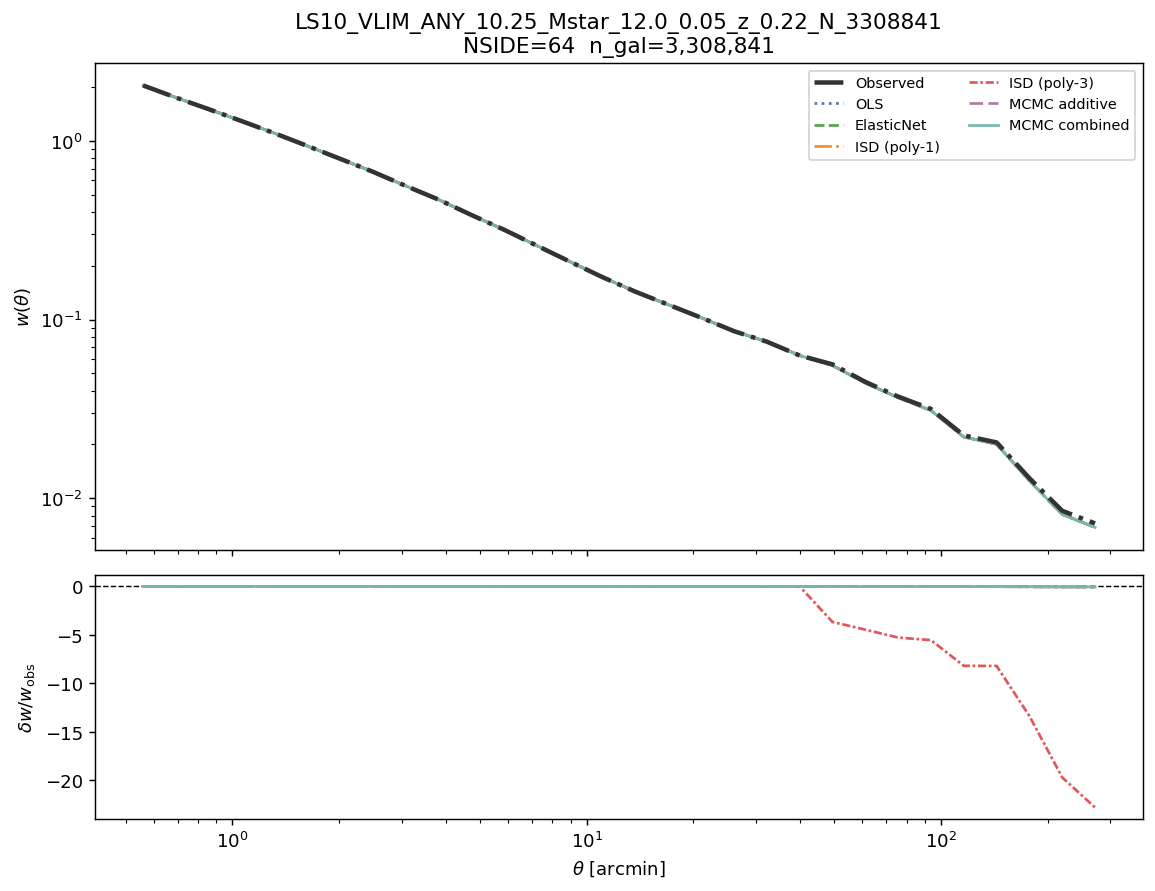
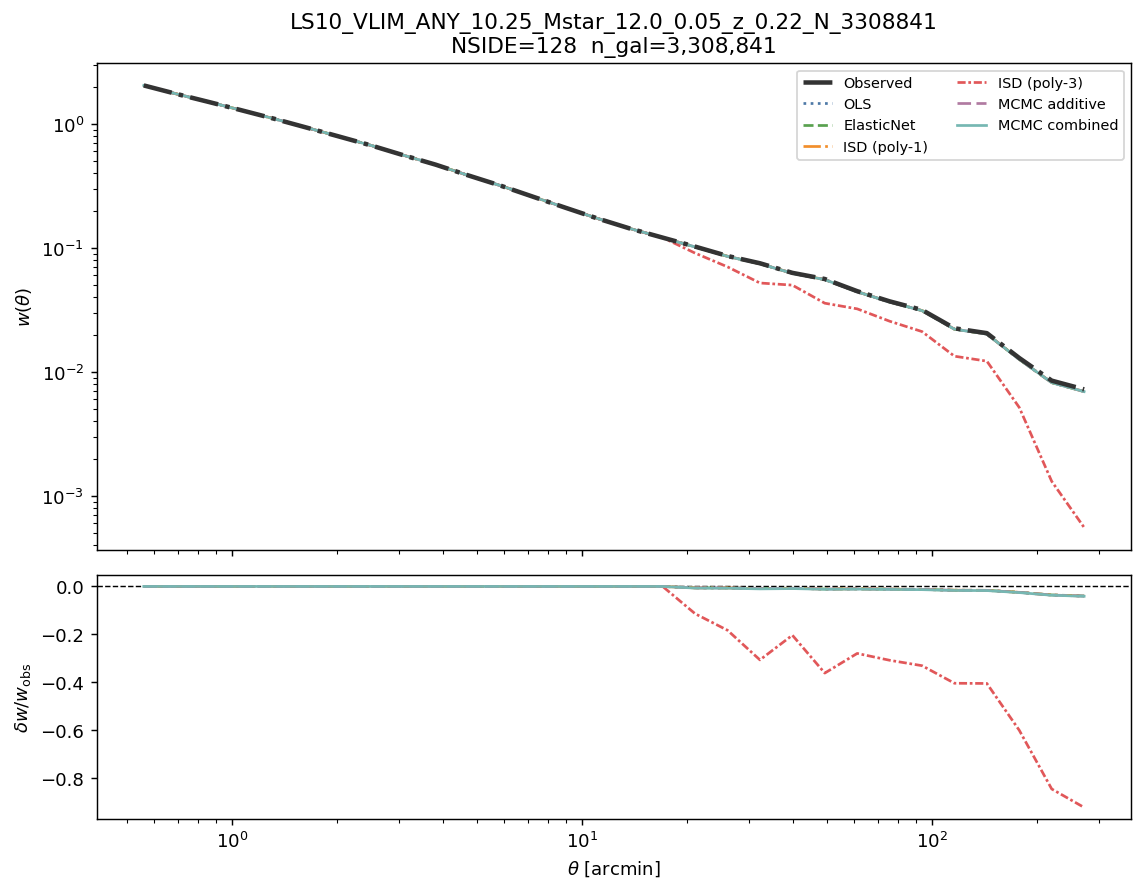
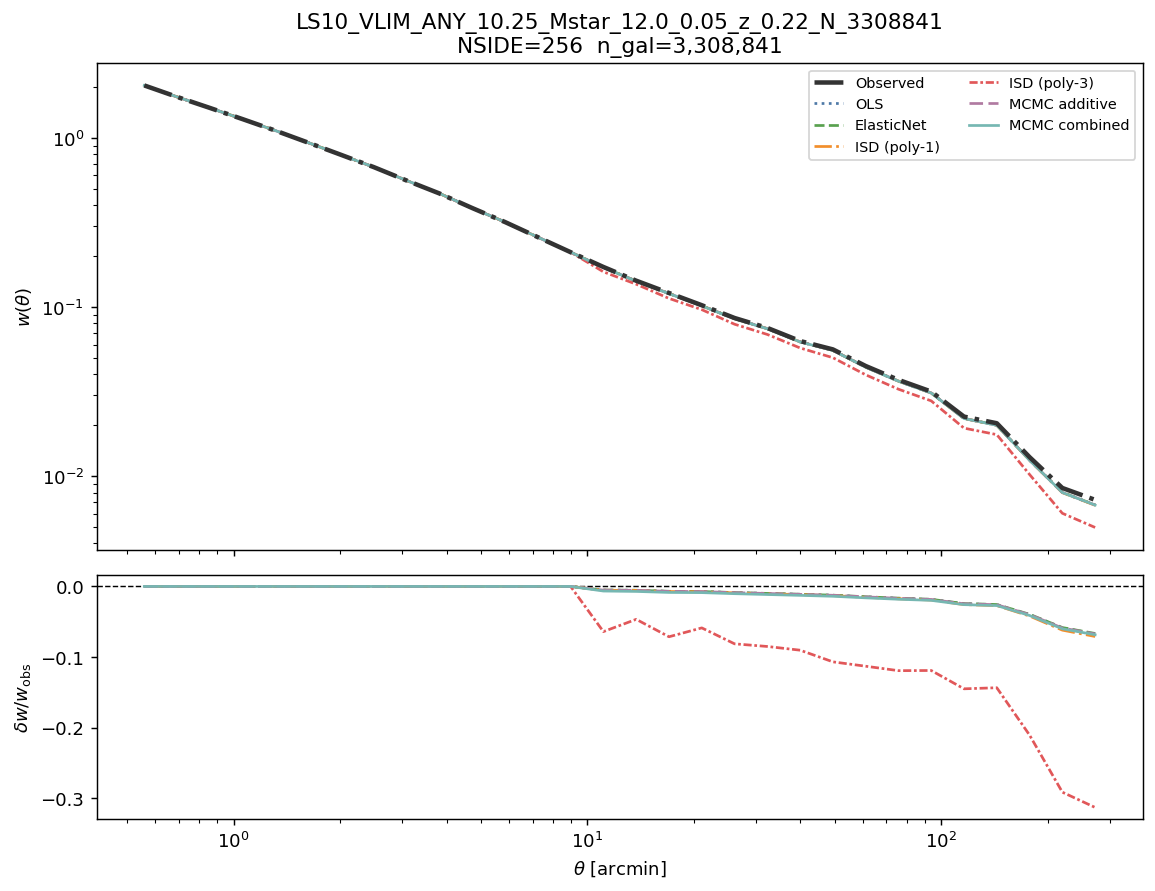
Angular clustering w(θ) before and after correction
Each panel shows the observed angular two-point correlation function (solid black) and the corrected \(w(\theta)\) for all six methods. A well-corrected sample shows suppressed excess clustering at all scales. Each panel corresponds to one map resolution.
w(θ): observed vs corrected — all six methods
Cosmological analysis verdict
Sub-degree scales: unknown (no empirical two-point measurement available).
Without correction: uncertain.
After correction: suitable after applying
WEIGHT_COMB.
LRT (NSIDE 64): \(\lambda_{\rm LR} = 66.9\) (dof = 11), p = 4.7e-10 → Reject H₀ — multiplicative contamination is statistically detected.
Recommendation: use WEIGHT_COMB (WEIGHT_SYS) for all science-grade analyses.