BGS VLIM log M* ≥ 10.75, z < 0.31 — detailed systematic analysis
Intermediate-mass BGS VLIM sample (2,802,710 galaxies, z < 0.31). The LRT rejects the additive null at NSIDE 64 (\(\lambda_{\rm LR} = 89.1\)).
See also
Results: systematic weights — summary tables and figures for all nine samples.
Sample statistics
Parameter |
NSIDE 32 |
NSIDE 64 |
NSIDE 128 |
NSIDE 256 |
|---|---|---|---|---|
Stellar-mass threshold |
log M* ≥ 10.75 |
log M* ≥ 10.75 |
log M* ≥ 10.75 |
log M* ≥ 10.75 |
Redshift limit |
z < 0.31 |
z < 0.31 |
z < 0.31 |
z < 0.31 |
Ngal |
2,802,710 |
2,802,710 |
2,802,710 |
2,802,710 |
Npix (good footprint) |
5,618 |
21,662 |
84,824 |
332,812 |
Ntemplates |
11 |
11 |
11 |
11 |
MCMC walkers |
210 |
210 |
210 |
210 |
MCMC steps after burn-in |
1500 |
1500 |
1500 |
1500 |
Goodness-of-fit: \(\hat{\sigma}\) by method and resolution
The noise parameter \(\hat{\sigma}\) measures residual scatter after systematic subtraction — lower is better. Results are shown for NSIDE 32, 64, 128, and 256. ISD-3 is unavailable at NSIDE 128 and 256 (no partial files generated at those resolutions).
Method |
\(\hat{\sigma}\) (N32) |
\(\hat{\sigma}\) (N64) |
\(\hat{\sigma}\) (N128) |
\(\hat{\sigma}\) (N256) |
Notes |
|---|---|---|---|---|---|
OLS |
0.3057 |
0.2831 |
0.4190 |
0.6422 |
closed-form least-squares |
ElasticNet |
0.3069 |
0.2831 |
0.4194 |
0.6423 |
L1+L2 regularised; 3-fold CV |
ISD-1 |
0.3057 |
0.2831 |
0.4190 |
0.6422 |
iterative self-calibration; poly order 1 |
ISD-3 † |
0.6315 |
0.4658 |
0.9265 |
0.6894 |
† degree-3 polynomial; unavailable at NSIDE 128/256 |
MCMC-add |
0.3061 |
0.2831 |
0.4191 |
0.6422 |
MCMC additive; acc N32=0.388 N64=0.392 |
MCMC-comb |
0.3982 |
0.3009 |
0.4300 |
0.6305 |
MCMC combined; acc N32=0.295 N64=0.281 |
† ISD-3 uses a degree-3 polynomial expansion and is ill-conditioned with correlated templates.
Likelihood Ratio Test (additive vs combined model)
Resolution |
\(\lambda_{\rm LR}\) |
dof |
p-value |
Reject H₀ |
|---|---|---|---|---|
NSIDE 32 |
1169.2 |
11 |
< 10-244 |
Yes |
NSIDE 64 |
89.1 |
11 |
< 10-14 |
Yes |
NSIDE 128 |
287.4 |
11 |
< 10-55 |
Yes |
NSIDE 256 |
580.6 |
11 |
< 10-117 |
Yes |
MCMC acceptance fractions: NSIDE 32: add 0.388, comb 0.295 NSIDE 64: add 0.392, comb 0.281 NSIDE 128: add 0.388, comb 0.293 NSIDE 256: add 0.388, comb 0.297. Healthy range: 0.15–0.50.
Template amplitude ranking — additive model (MCMC-add, NSIDE 64)
All 11 templates sorted by absolute MCMC-add additive amplitude \(|\hat{a}_i|\). OLS shown for comparison.
Rank |
Template |
NSIDE |
\(\hat{a}_i\) (MCMC-add) |
\(\hat{a}_i\) (OLS) |
Physical meaning |
|---|---|---|---|---|---|
1 |
GAIA_nstar_faint |
64 |
+0.3222 |
+0.3268 |
GAIA faint stellar density (photometric mis-classification of faint stars as galaxies) |
2 |
GAIA_nstar_medium |
64 |
-0.2216 |
-0.2251 |
GAIA medium stellar density (crowding and deblending near bright stars) |
3 |
GAIA_phot_rp_mean_flux |
64 |
-0.0415 |
-0.0418 |
GAIA mean stellar flux in RP band (red scattered light) |
4 |
GAIA_phot_g_mean_flux |
64 |
+0.0290 |
+0.0292 |
GAIA mean stellar flux in G band (scattered-light / sky-background variations) |
5 |
GAIA_phot_bp_mean_flux |
64 |
-0.0149 |
-0.0146 |
GAIA mean stellar flux in BP band (blue scattered light) |
6 |
LS10_EBV_NSIDE_0064 |
? |
-0.0122 |
-0.0122 |
LS10_EBV_NSIDE_0064 |
7 |
LS10_GALDEPTH_R_NSIDE_0064 |
? |
+0.0076 |
+0.0075 |
LS10_GALDEPTH_R_NSIDE_0064 |
8 |
LS10_PSFSIZE_R_NSIDE_0064 |
? |
-0.0047 |
-0.0048 |
LS10_PSFSIZE_R_NSIDE_0064 |
9 |
LS10_GALDEPTH_Z_NSIDE_0064 |
? |
+0.0045 |
+0.0045 |
LS10_GALDEPTH_Z_NSIDE_0064 |
10 |
LS10_NOBS_R_NSIDE_0064 |
? |
-0.0023 |
-0.0022 |
LS10_NOBS_R_NSIDE_0064 |
11 |
LS10_GALDEPTH_G_NSIDE_0064 |
? |
+0.0017 |
+0.0016 |
LS10_GALDEPTH_G_NSIDE_0064 |
Template amplitude ranking — multiplicative model (MCMC-comb, NSIDE 64)
All 11 templates sorted by absolute MCMC-comb multiplicative amplitude \(|\hat{b}_i|\).
Rank |
Template |
NSIDE |
\(\hat{b}_i\) (MCMC-comb) |
Physical meaning |
|---|---|---|---|---|
1 |
GAIA_nstar_faint |
64 |
+0.6170 |
GAIA faint stellar density (photometric mis-classification of faint stars as galaxies) |
2 |
GAIA_nstar_medium |
64 |
-0.3227 |
GAIA medium stellar density (crowding and deblending near bright stars) |
3 |
GAIA_phot_rp_mean_flux |
64 |
-0.0498 |
GAIA mean stellar flux in RP band (red scattered light) |
4 |
GAIA_phot_g_mean_flux |
64 |
+0.0250 |
GAIA mean stellar flux in G band (scattered-light / sky-background variations) |
5 |
LS10_NOBS_R_NSIDE_0064 |
? |
+0.0166 |
LS10_NOBS_R_NSIDE_0064 |
6 |
LS10_PSFSIZE_R_NSIDE_0064 |
? |
+0.0129 |
LS10_PSFSIZE_R_NSIDE_0064 |
7 |
LS10_EBV_NSIDE_0064 |
? |
+0.0117 |
LS10_EBV_NSIDE_0064 |
8 |
LS10_GALDEPTH_R_NSIDE_0064 |
? |
+0.0109 |
LS10_GALDEPTH_R_NSIDE_0064 |
9 |
GAIA_phot_bp_mean_flux |
64 |
-0.0108 |
GAIA mean stellar flux in BP band (blue scattered light) |
10 |
LS10_GALDEPTH_Z_NSIDE_0064 |
? |
-0.0076 |
LS10_GALDEPTH_Z_NSIDE_0064 |
11 |
LS10_GALDEPTH_G_NSIDE_0064 |
? |
-0.0050 |
LS10_GALDEPTH_G_NSIDE_0064 |
Per-galaxy weight statistics (NSIDE 64)
From the *_NSIDE0064_WEIGHTS.fits file. Mean ≈ 1 and small std indicate a well-behaved weight distribution.
Method |
N |
mean |
std |
p1 |
p5 |
p50 |
p95 |
p99 |
|---|---|---|---|---|---|---|---|---|
OLS |
2,802,710 |
0.9976 |
0.0325 |
0.9371 |
0.9566 |
0.9932 |
1.0548 |
1.0866 |
ElasticNet |
2,802,710 |
0.9970 |
0.0311 |
0.9376 |
0.9573 |
0.9931 |
1.0509 |
1.0817 |
ISD-1 |
2,802,710 |
0.9975 |
0.0326 |
0.9368 |
0.9565 |
0.9932 |
1.0548 |
1.0869 |
ISD-3 † |
2,802,710 |
1.4256 |
6.3201 |
0.6910 |
0.8561 |
0.9801 |
1.2456 |
1.7699 |
MCMC-add |
2,802,710 |
0.9975 |
0.0324 |
0.9368 |
0.9567 |
0.9932 |
1.0544 |
1.0861 |
MCMC-comb |
2,802,710 |
1.0658 |
0.0391 |
0.9604 |
1.0028 |
1.0661 |
1.1213 |
1.1747 |
Systematic weight maps
Mollweide weight maps — all six methods
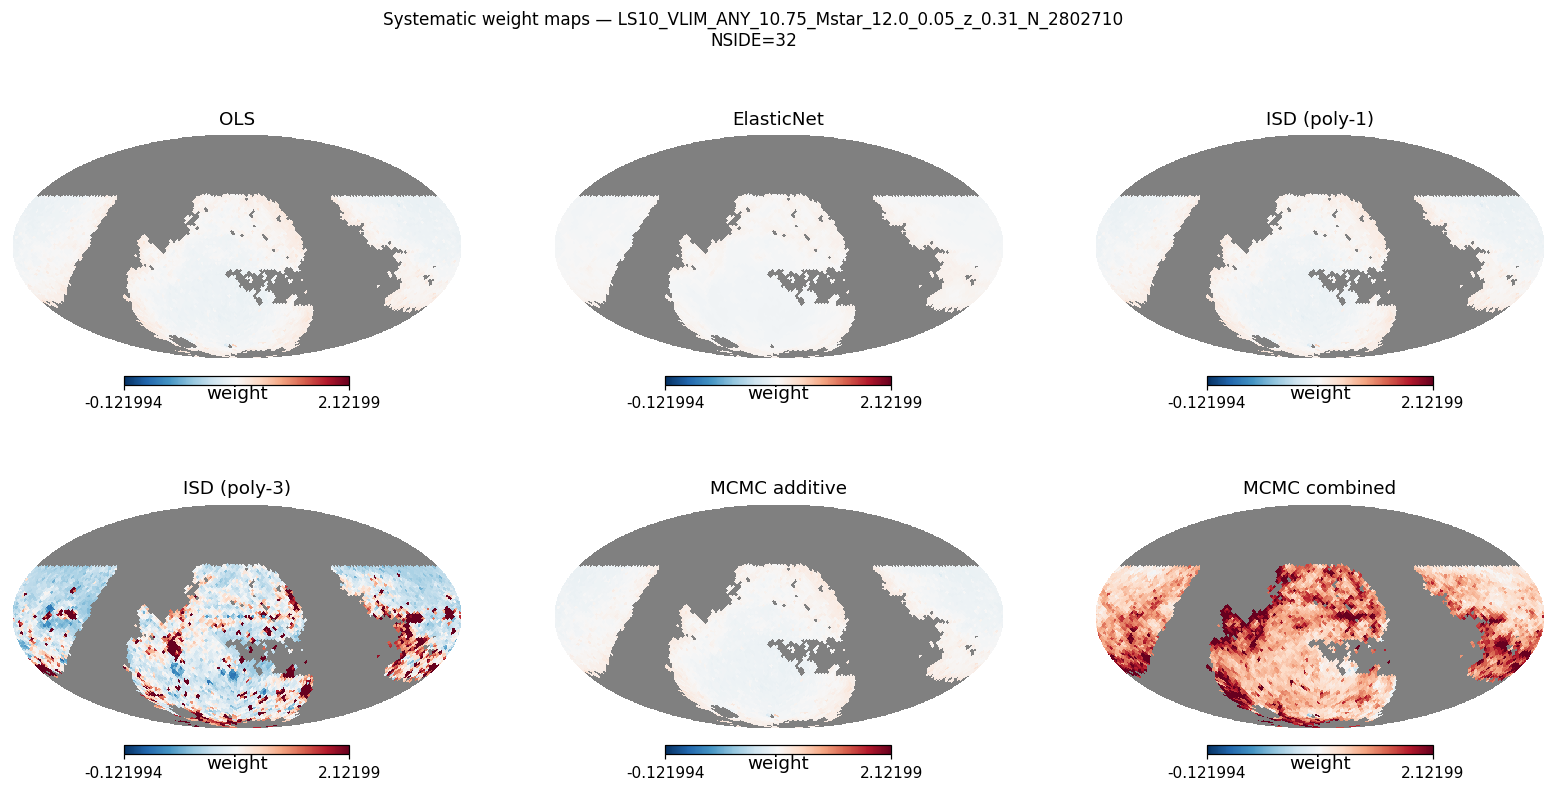
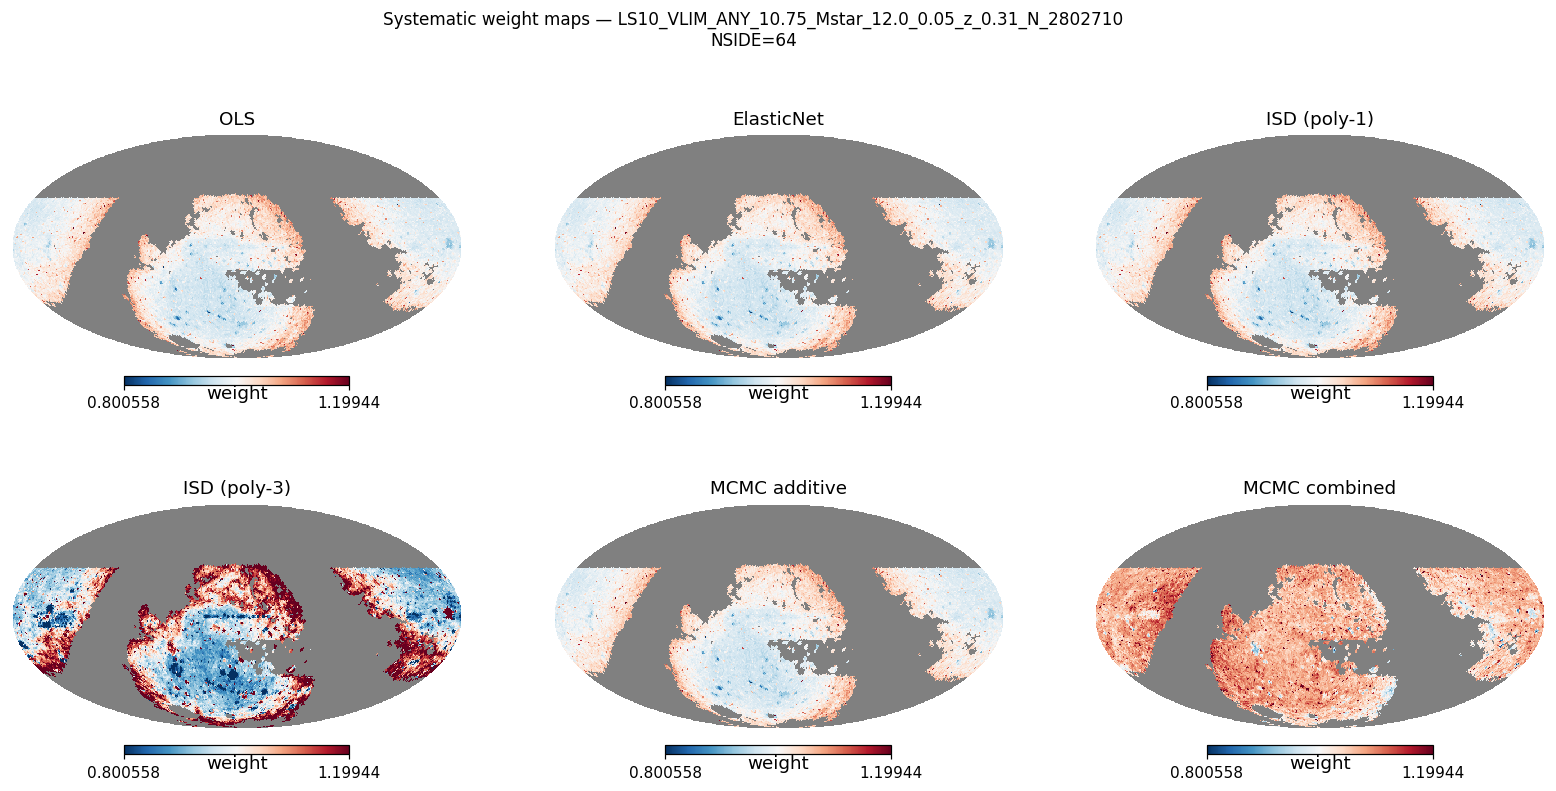
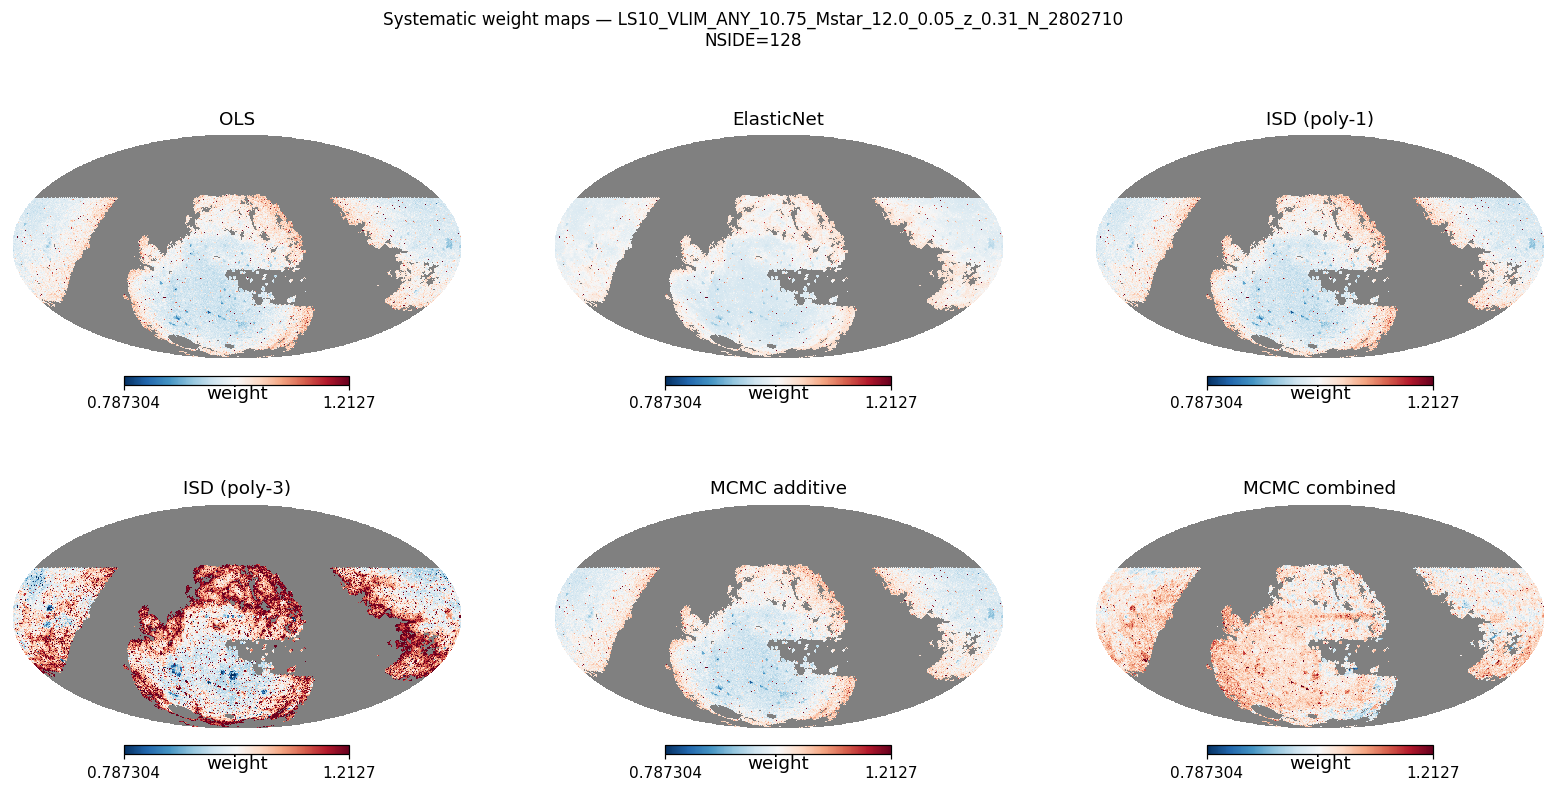
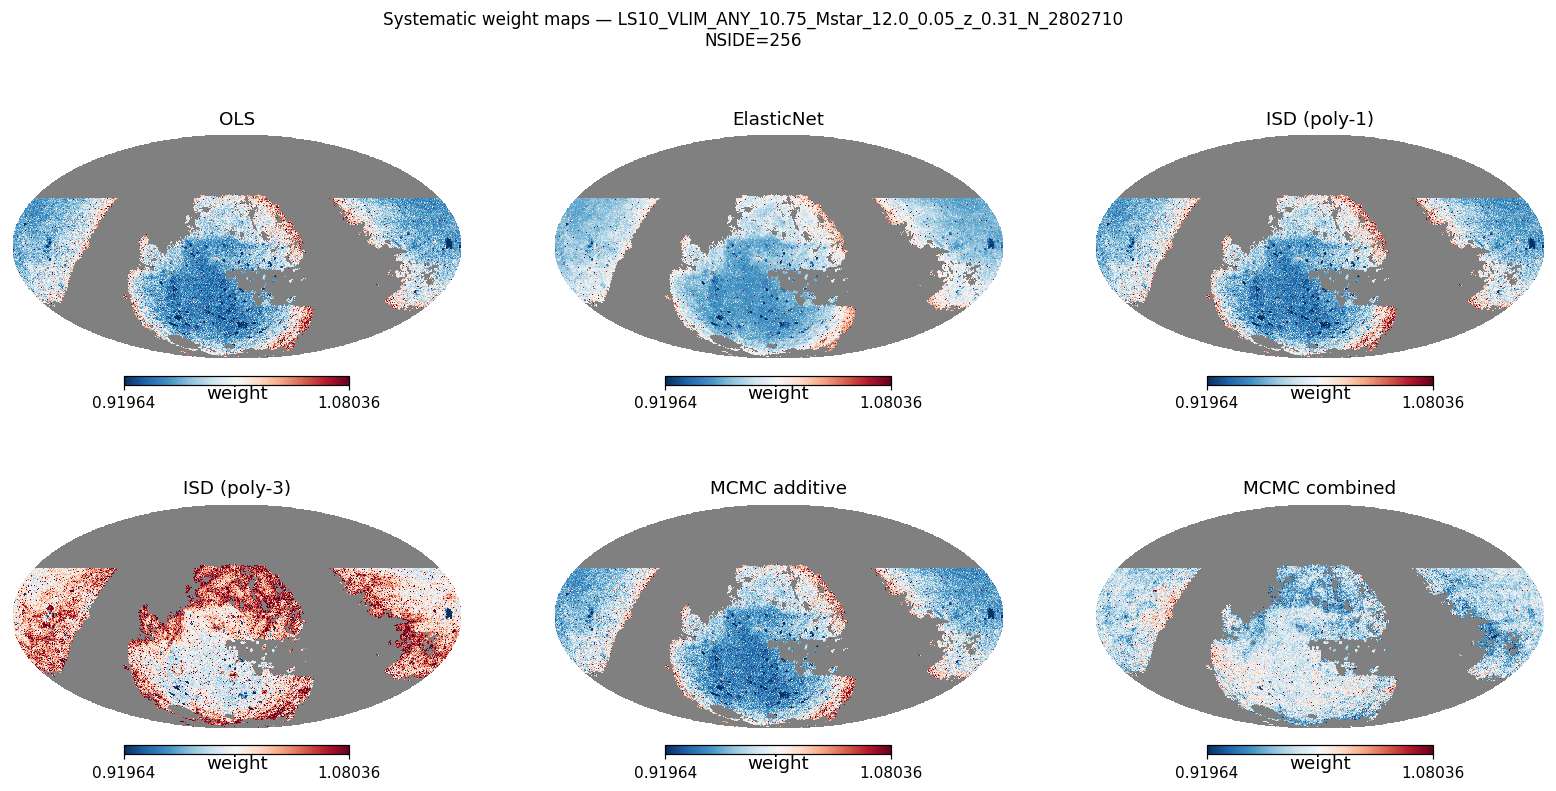
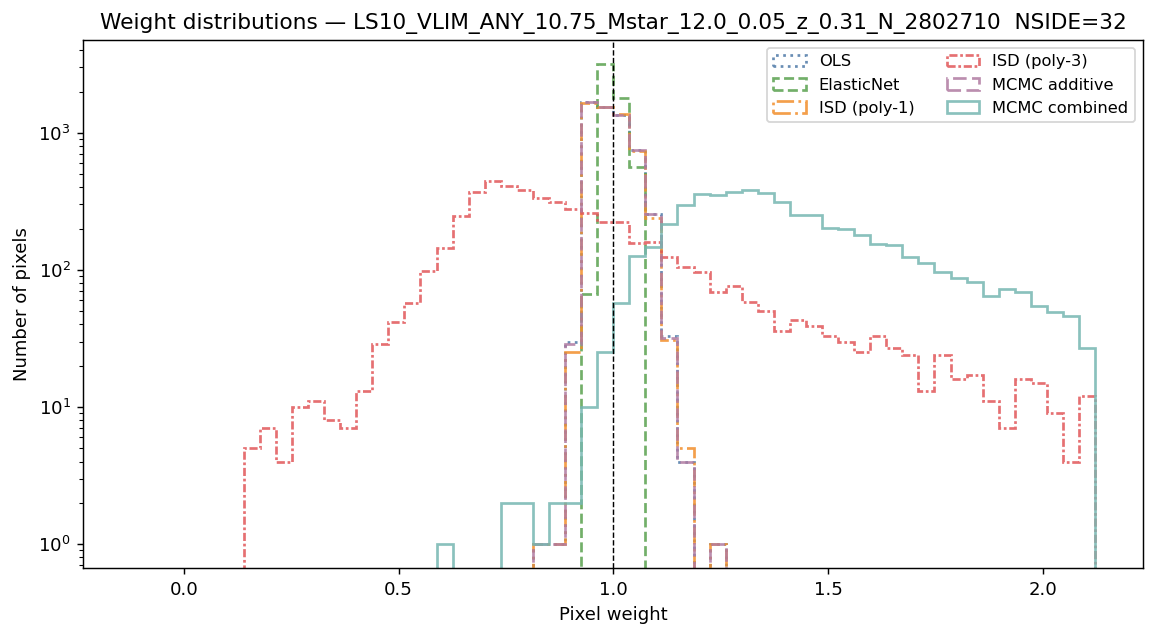
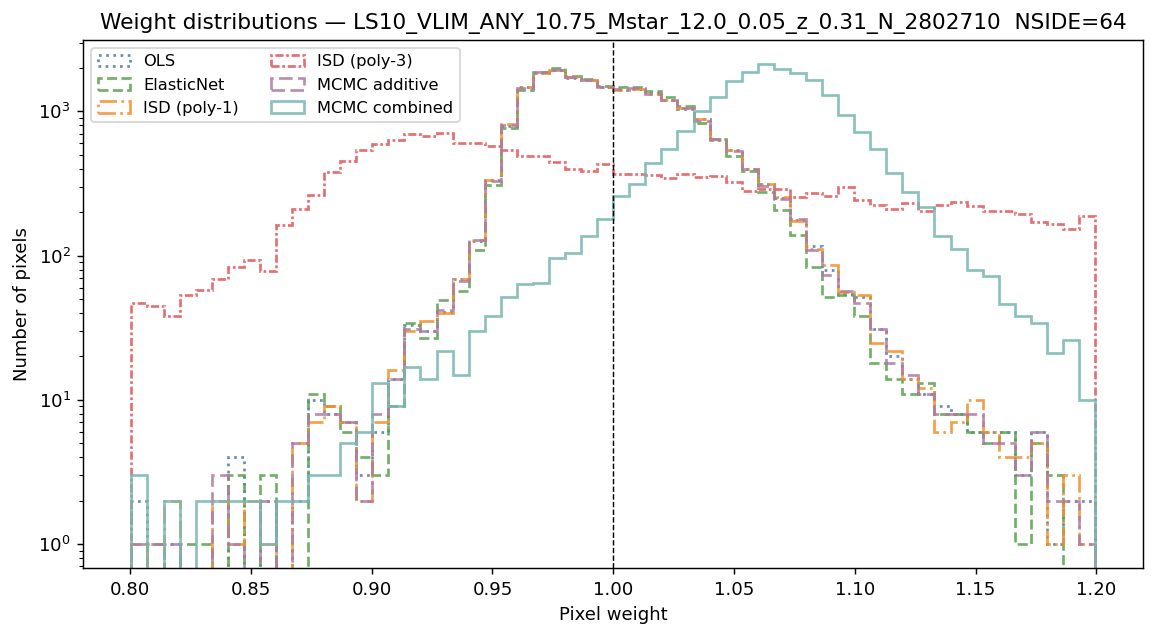
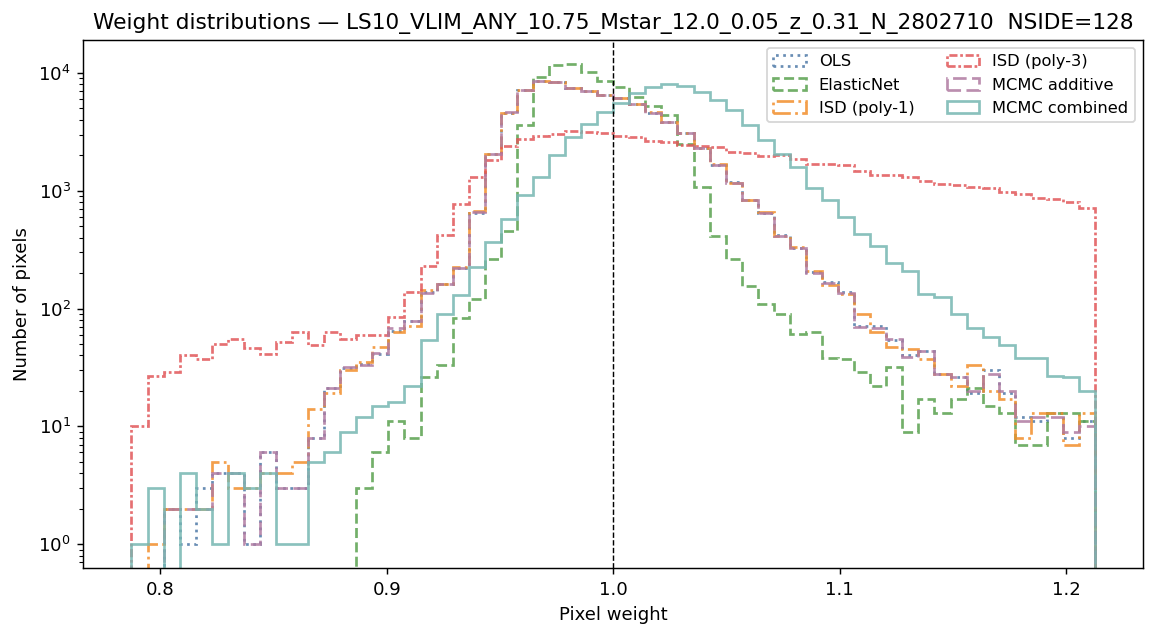
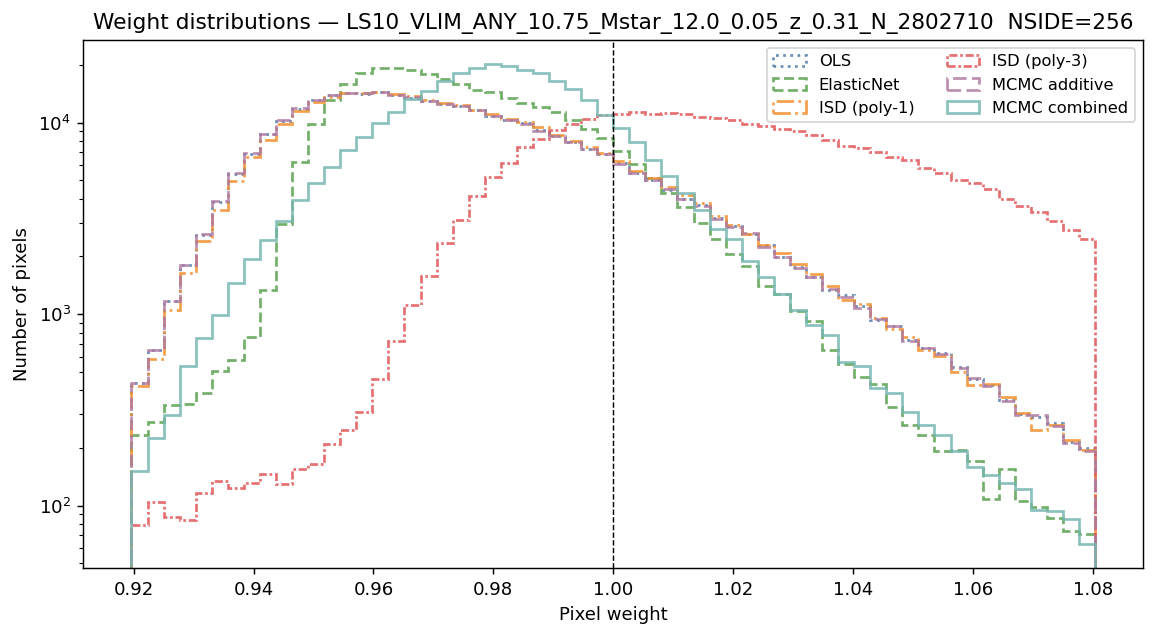
Systematic weight distributions
Narrow peaks near 1 indicate stable weight estimates. ElasticNet weights may be exactly 1 when cross-validation selects zero amplitudes.
Per-galaxy weight distributions — all six methods
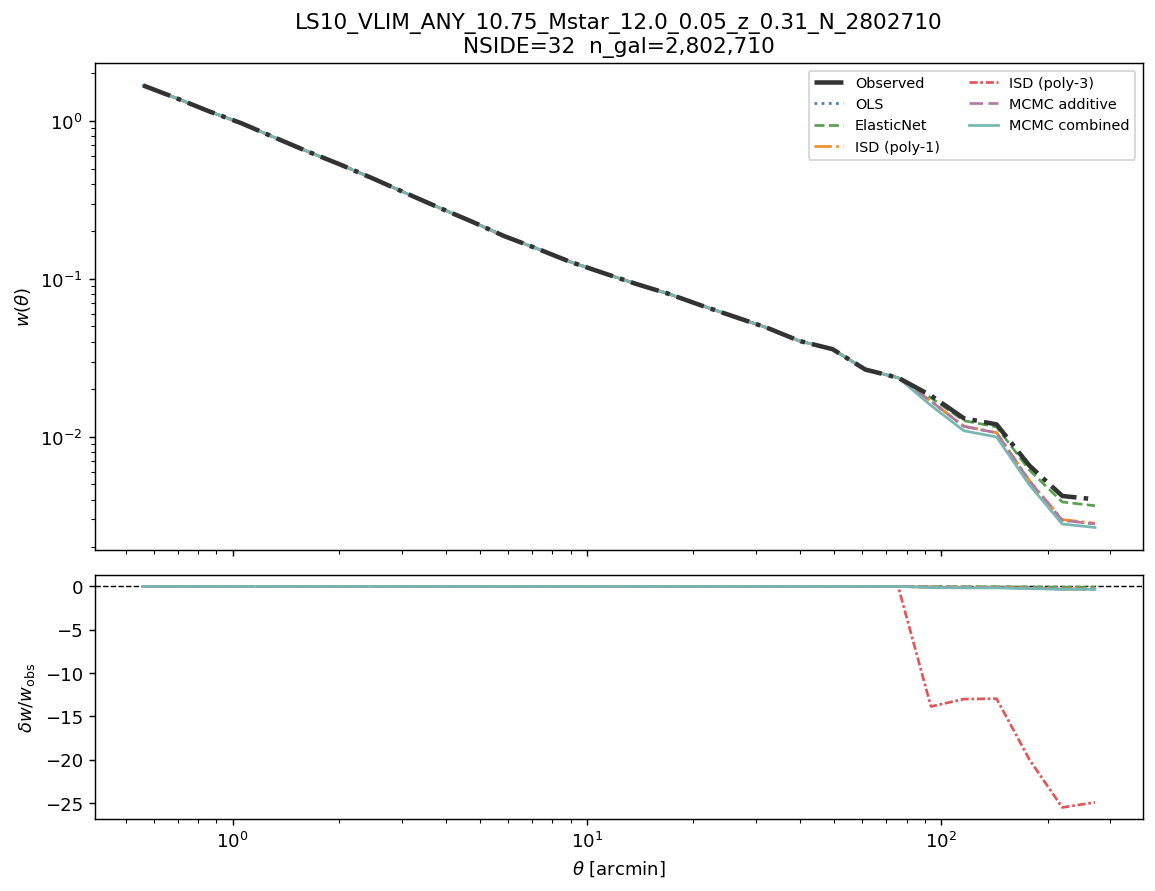
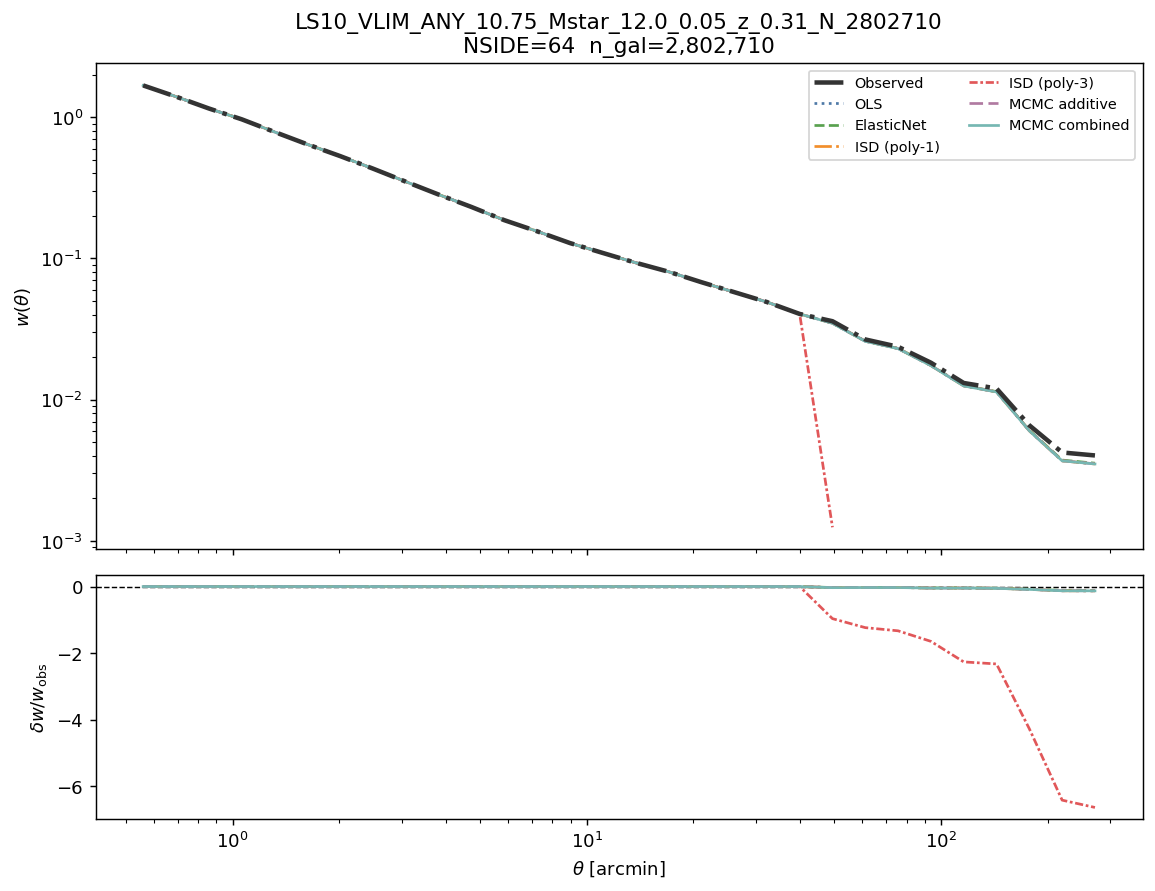
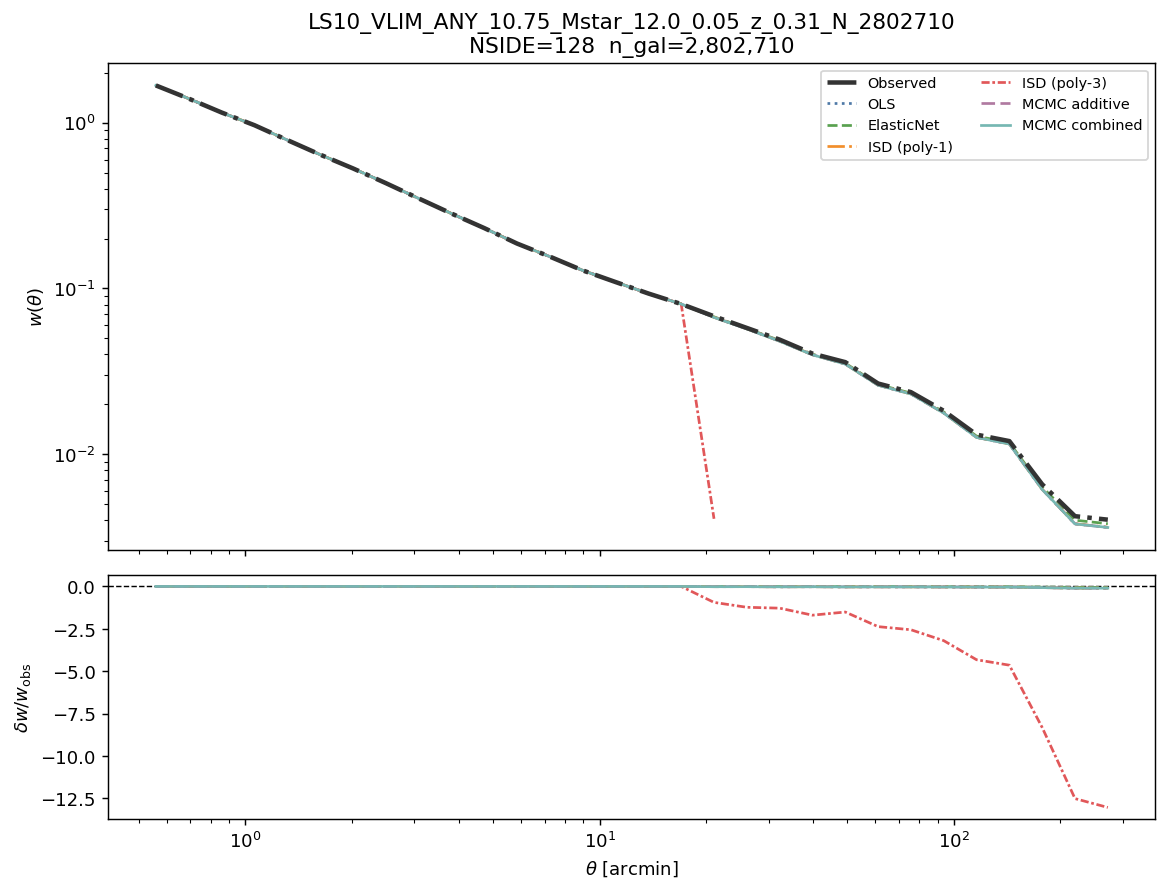
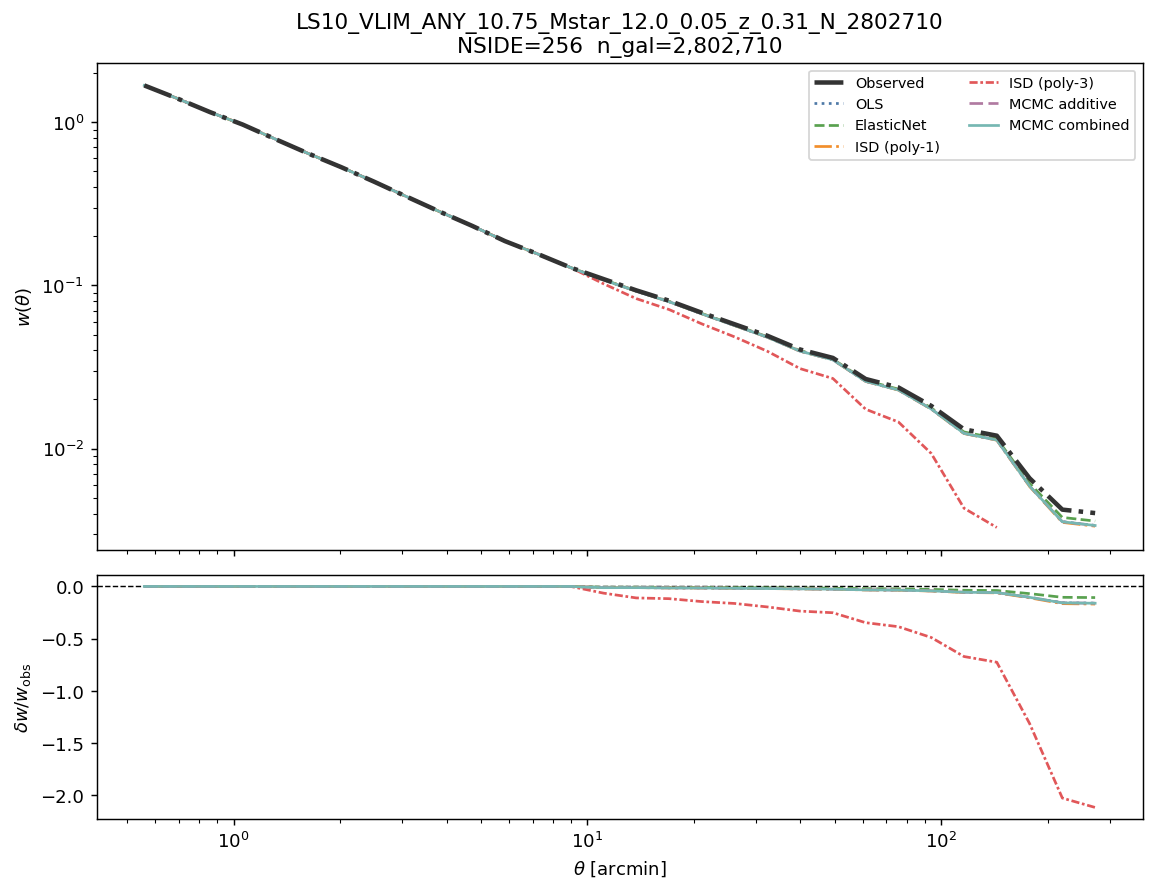
Angular clustering w(θ) before and after correction
Each panel shows the observed angular two-point correlation function (solid black) and the corrected \(w(\theta)\) for all six methods. A well-corrected sample shows suppressed excess clustering at all scales. Each panel corresponds to one map resolution.
w(θ): observed vs corrected — all six methods
Cosmological analysis verdict
Sub-degree scales: unknown (no empirical two-point measurement available).
Without correction: uncertain.
After correction: suitable after applying
WEIGHT_COMB.
LRT (NSIDE 64): \(\lambda_{\rm LR} = 89.1\) (dof = 11), p = 2.5e-14 → Reject H₀ — multiplicative contamination is statistically detected.
Recommendation: use WEIGHT_COMB (WEIGHT_SYS) for all science-grade analyses.