BGS VLIM log M* ≥ 11.0, z < 0.35 — detailed systematic analysis
High-mass BGS VLIM sample (1,619,838 galaxies, z < 0.35). Shot noise dominates per-pixel statistics at both resolutions. The LRT rejects the additive null at NSIDE 64 (\(\lambda_{\rm LR} = 75.1\)).
See also
Results: systematic weights — summary tables and figures for all nine samples.
Sample statistics
Parameter |
NSIDE 32 |
NSIDE 64 |
NSIDE 128 |
NSIDE 256 |
|---|---|---|---|---|
Stellar-mass threshold |
log M* ≥ 11.0 |
log M* ≥ 11.0 |
log M* ≥ 11.0 |
log M* ≥ 11.0 |
Redshift limit |
z < 0.35 |
z < 0.35 |
z < 0.35 |
z < 0.35 |
Ngal |
1,619,838 |
1,619,838 |
1,619,838 |
1,619,838 |
Npix (good footprint) |
5,614 |
21,646 |
84,719 |
332,484 |
Ntemplates |
11 |
11 |
11 |
11 |
MCMC walkers |
210 |
210 |
210 |
210 |
MCMC steps after burn-in |
1500 |
1500 |
1500 |
1500 |
Goodness-of-fit: \(\hat{\sigma}\) by method and resolution
The noise parameter \(\hat{\sigma}\) measures residual scatter after systematic subtraction — lower is better. Results are shown for NSIDE 32, 64, 128, and 256. ISD-3 is unavailable at NSIDE 128 and 256 (no partial files generated at those resolutions).
Method |
\(\hat{\sigma}\) (N32) |
\(\hat{\sigma}\) (N64) |
\(\hat{\sigma}\) (N128) |
\(\hat{\sigma}\) (N256) |
Notes |
|---|---|---|---|---|---|
OLS |
0.2971 |
0.2974 |
0.4580 |
0.7557 |
closed-form least-squares |
ElasticNet |
0.2985 |
0.2974 |
0.4580 |
0.7558 |
L1+L2 regularised; 3-fold CV |
ISD-1 |
0.2971 |
0.2974 |
0.4580 |
0.7558 |
iterative self-calibration; poly order 1 |
ISD-3 † |
0.7040 |
0.4975 |
0.4899 |
0.7786 |
† degree-3 polynomial; unavailable at NSIDE 128/256 |
MCMC-add |
0.2974 |
0.2975 |
0.4580 |
0.7558 |
MCMC additive; acc N32=0.389 N64=0.390 |
MCMC-comb |
0.3927 |
0.3052 |
0.4716 |
0.7256 |
MCMC combined; acc N32=0.292 N64=0.289 |
† ISD-3 uses a degree-3 polynomial expansion and is ill-conditioned with correlated templates.
Likelihood Ratio Test (additive vs combined model)
Resolution |
\(\lambda_{\rm LR}\) |
dof |
p-value |
Reject H₀ |
|---|---|---|---|---|
NSIDE 32 |
997.4 |
11 |
< 10-207 |
Yes |
NSIDE 64 |
75.1 |
11 |
< 10-11 |
Yes |
NSIDE 128 |
206.1 |
11 |
< 10-38 |
Yes |
NSIDE 256 |
682.0 |
11 |
< 10-139 |
Yes |
MCMC acceptance fractions: NSIDE 32: add 0.389, comb 0.292 NSIDE 64: add 0.390, comb 0.289 NSIDE 128: add 0.389, comb 0.291 NSIDE 256: add 0.388, comb 0.288. Healthy range: 0.15–0.50.
Template amplitude ranking — additive model (MCMC-add, NSIDE 64)
All 11 templates sorted by absolute MCMC-add additive amplitude \(|\hat{a}_i|\). OLS shown for comparison.
Rank |
Template |
NSIDE |
\(\hat{a}_i\) (MCMC-add) |
\(\hat{a}_i\) (OLS) |
Physical meaning |
|---|---|---|---|---|---|
1 |
GAIA_nstar_faint |
64 |
+0.3608 |
+0.3616 |
GAIA faint stellar density (photometric mis-classification of faint stars as galaxies) |
2 |
GAIA_nstar_medium |
64 |
-0.2525 |
-0.2531 |
GAIA medium stellar density (crowding and deblending near bright stars) |
3 |
GAIA_phot_rp_mean_flux |
64 |
-0.0427 |
-0.0428 |
GAIA mean stellar flux in RP band (red scattered light) |
4 |
GAIA_phot_g_mean_flux |
64 |
+0.0316 |
+0.0314 |
GAIA mean stellar flux in G band (scattered-light / sky-background variations) |
5 |
GAIA_phot_bp_mean_flux |
64 |
-0.0174 |
-0.0170 |
GAIA mean stellar flux in BP band (blue scattered light) |
6 |
LS10_GALDEPTH_G_NSIDE_0064 |
? |
+0.0067 |
+0.0068 |
LS10_GALDEPTH_G_NSIDE_0064 |
7 |
LS10_PSFSIZE_R_NSIDE_0064 |
? |
-0.0067 |
-0.0067 |
LS10_PSFSIZE_R_NSIDE_0064 |
8 |
LS10_EBV_NSIDE_0064 |
? |
-0.0060 |
-0.0060 |
LS10_EBV_NSIDE_0064 |
9 |
LS10_GALDEPTH_Z_NSIDE_0064 |
? |
+0.0055 |
+0.0055 |
LS10_GALDEPTH_Z_NSIDE_0064 |
10 |
LS10_GALDEPTH_R_NSIDE_0064 |
? |
+0.0046 |
+0.0046 |
LS10_GALDEPTH_R_NSIDE_0064 |
11 |
LS10_NOBS_R_NSIDE_0064 |
? |
+0.0011 |
+0.0012 |
LS10_NOBS_R_NSIDE_0064 |
Template amplitude ranking — multiplicative model (MCMC-comb, NSIDE 64)
All 11 templates sorted by absolute MCMC-comb multiplicative amplitude \(|\hat{b}_i|\).
Rank |
Template |
NSIDE |
\(\hat{b}_i\) (MCMC-comb) |
Physical meaning |
|---|---|---|---|---|
1 |
GAIA_nstar_faint |
64 |
+0.3700 |
GAIA faint stellar density (photometric mis-classification of faint stars as galaxies) |
2 |
GAIA_nstar_medium |
64 |
-0.2100 |
GAIA medium stellar density (crowding and deblending near bright stars) |
3 |
GAIA_phot_rp_mean_flux |
64 |
-0.0359 |
GAIA mean stellar flux in RP band (red scattered light) |
4 |
GAIA_phot_g_mean_flux |
64 |
+0.0332 |
GAIA mean stellar flux in G band (scattered-light / sky-background variations) |
5 |
LS10_EBV_NSIDE_0064 |
? |
+0.0297 |
LS10_EBV_NSIDE_0064 |
6 |
GAIA_phot_bp_mean_flux |
64 |
-0.0251 |
GAIA mean stellar flux in BP band (blue scattered light) |
7 |
LS10_GALDEPTH_R_NSIDE_0064 |
? |
+0.0139 |
LS10_GALDEPTH_R_NSIDE_0064 |
8 |
LS10_NOBS_R_NSIDE_0064 |
? |
+0.0101 |
LS10_NOBS_R_NSIDE_0064 |
9 |
LS10_GALDEPTH_G_NSIDE_0064 |
? |
+0.0049 |
LS10_GALDEPTH_G_NSIDE_0064 |
10 |
LS10_PSFSIZE_R_NSIDE_0064 |
? |
+0.0044 |
LS10_PSFSIZE_R_NSIDE_0064 |
11 |
LS10_GALDEPTH_Z_NSIDE_0064 |
? |
-0.0026 |
LS10_GALDEPTH_Z_NSIDE_0064 |
Per-galaxy weight statistics (NSIDE 64)
From the *_NSIDE0064_WEIGHTS.fits file. Mean ≈ 1 and small std indicate a well-behaved weight distribution.
Method |
N |
mean |
std |
p1 |
p5 |
p50 |
p95 |
p99 |
|---|---|---|---|---|---|---|---|---|
OLS |
1,619,838 |
0.9968 |
0.0337 |
0.9268 |
0.9536 |
0.9926 |
1.0563 |
1.0898 |
ElasticNet |
1,619,838 |
0.9963 |
0.0323 |
0.9268 |
0.9543 |
0.9927 |
1.0524 |
1.0847 |
ISD-1 |
1,619,838 |
0.9968 |
0.0339 |
0.9257 |
0.9533 |
0.9925 |
1.0567 |
1.0904 |
ISD-3 † |
1,619,838 |
1.8086 |
8.4772 |
0.5103 |
0.7973 |
1.0347 |
1.3246 |
4.4536 |
MCMC-add |
1,619,838 |
0.9968 |
0.0337 |
0.9267 |
0.9535 |
0.9926 |
1.0563 |
1.0897 |
MCMC-comb |
1,619,838 |
1.0292 |
0.0352 |
0.9239 |
0.9707 |
1.0333 |
1.0763 |
1.1131 |
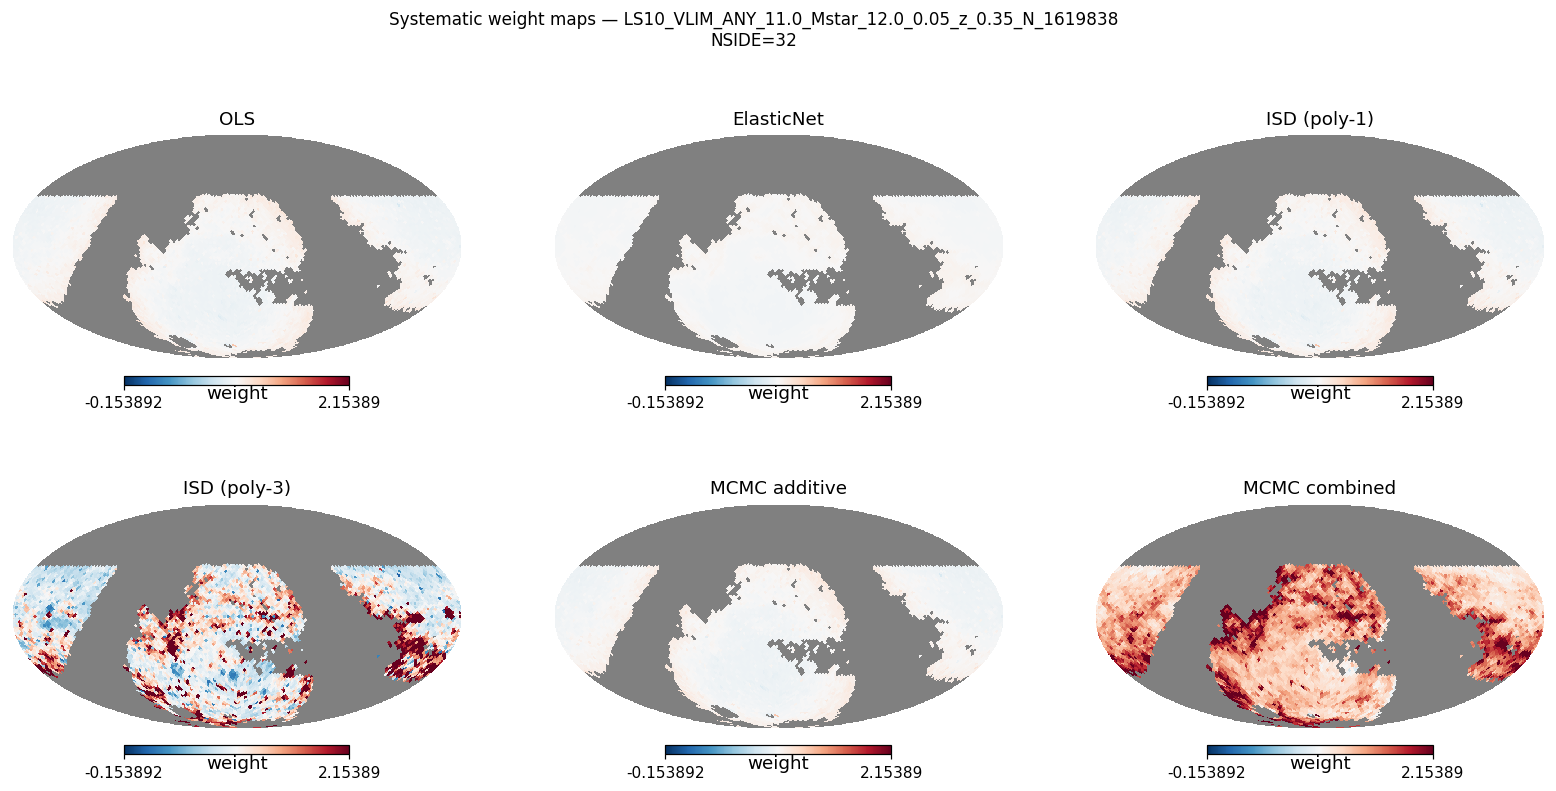
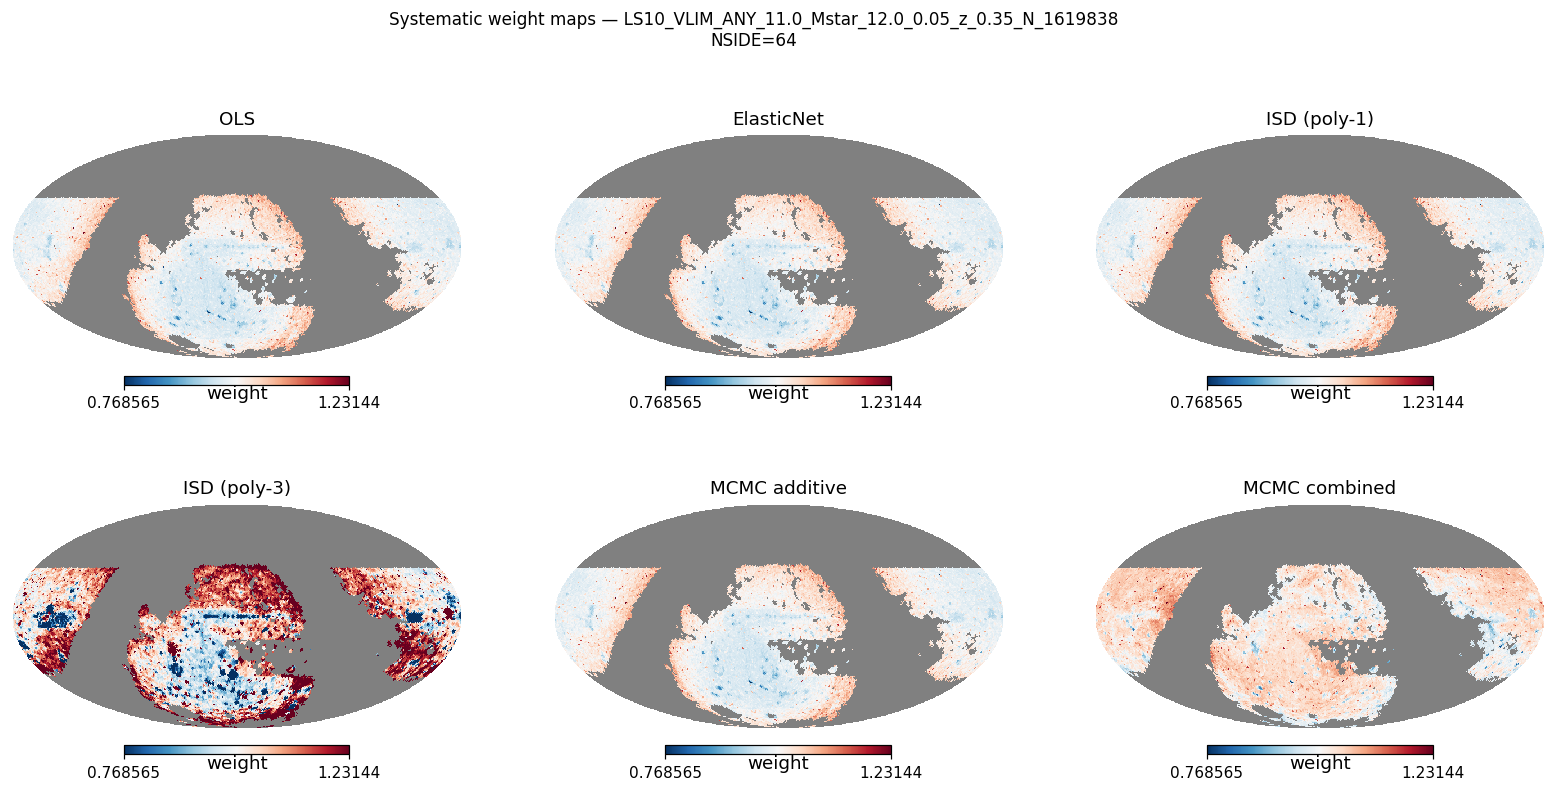
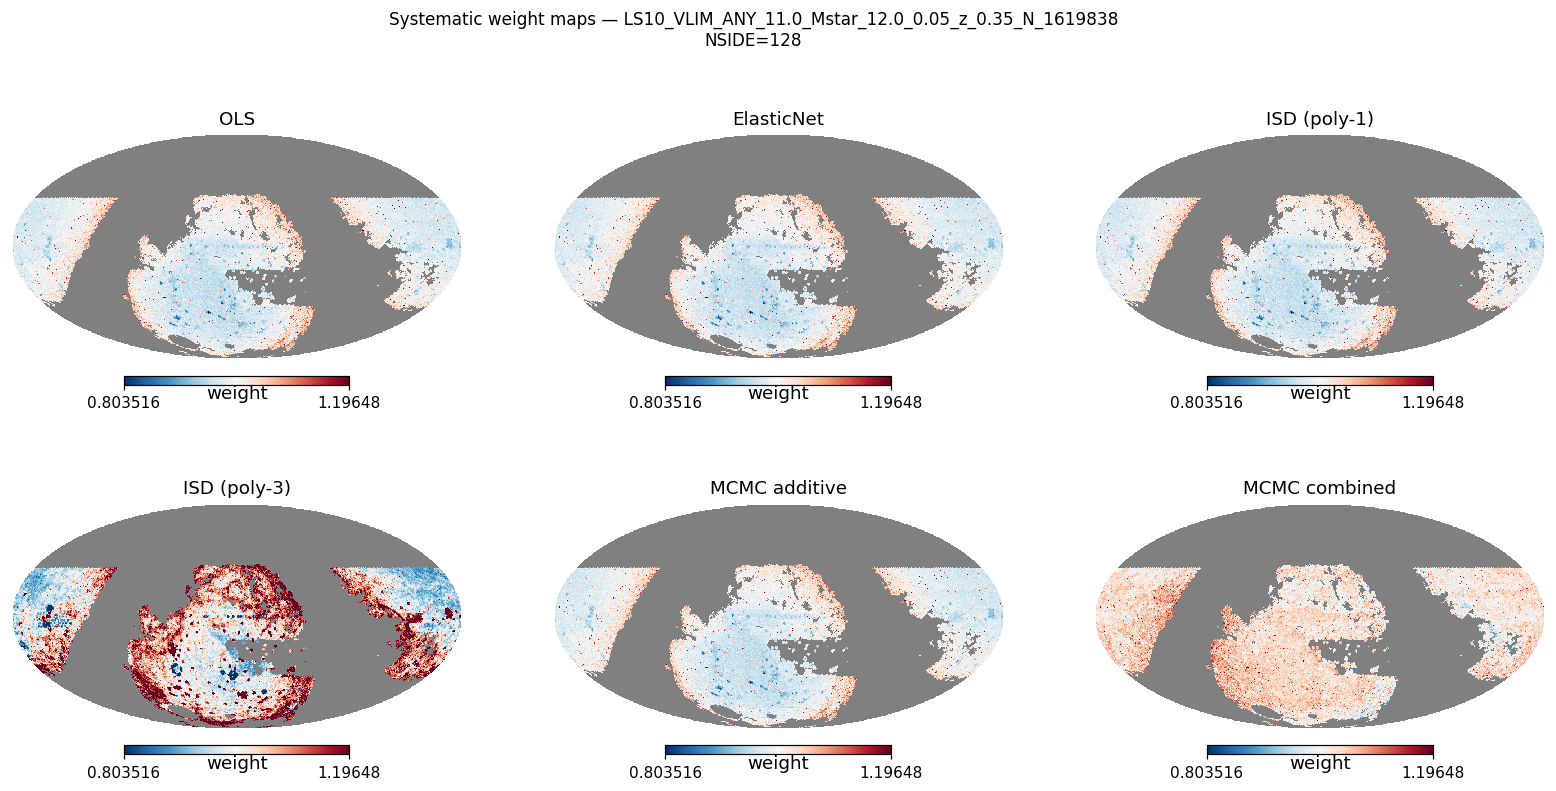
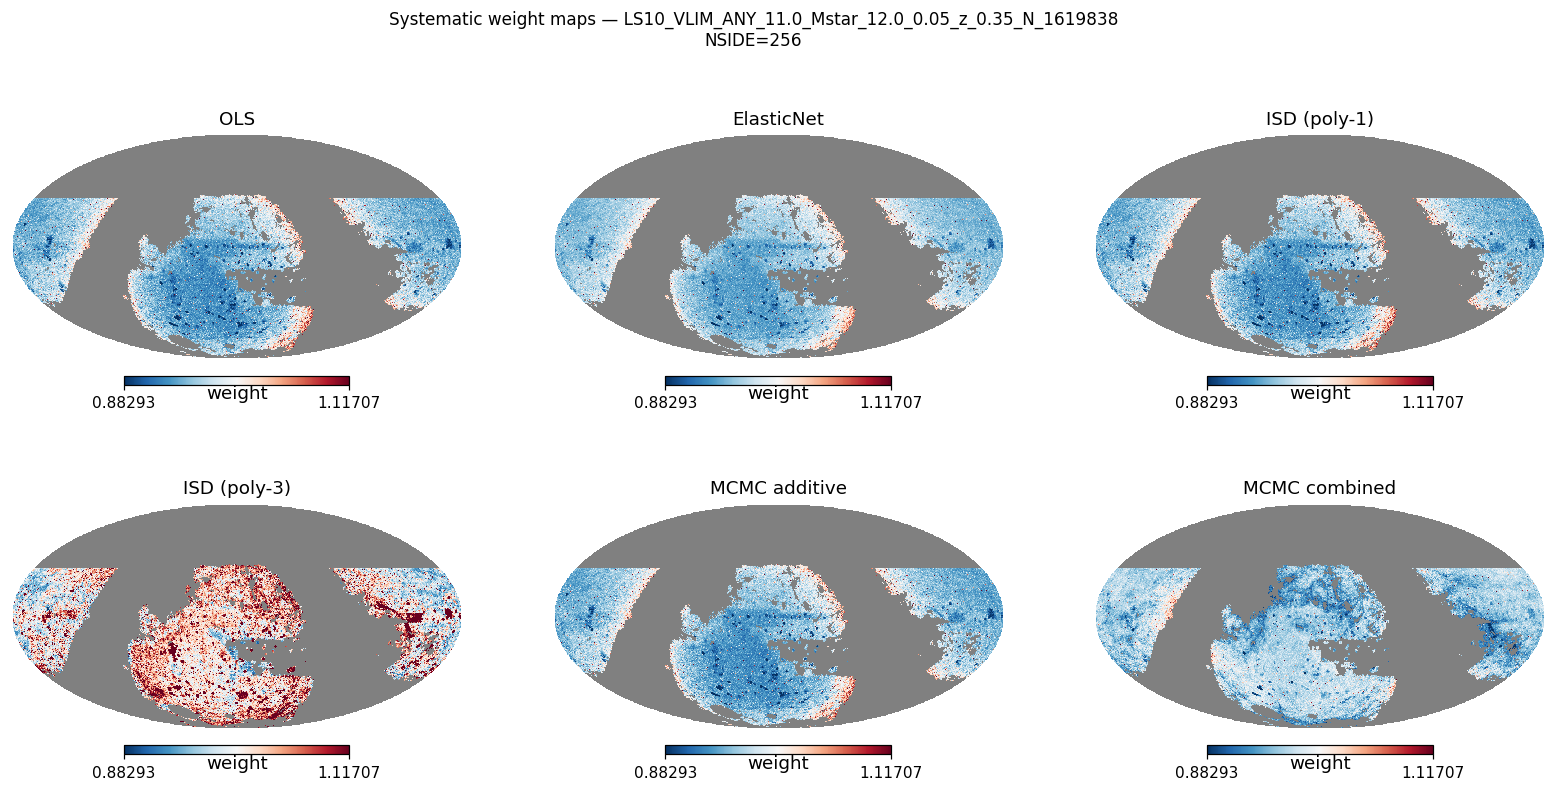
Systematic weight maps
Mollweide weight maps — all six methods
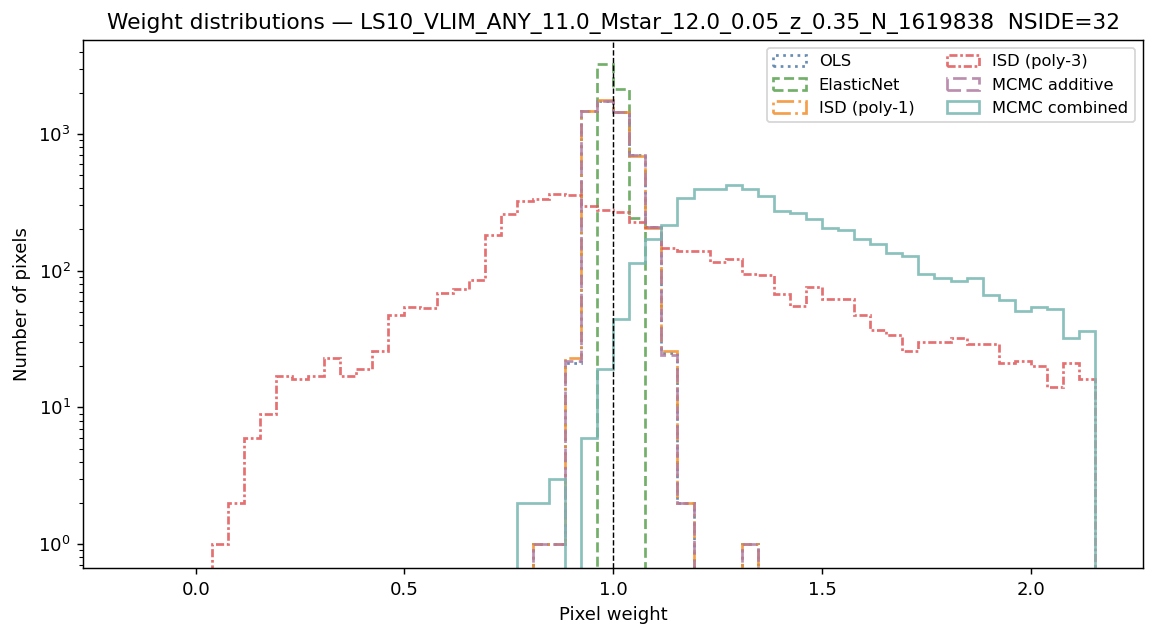
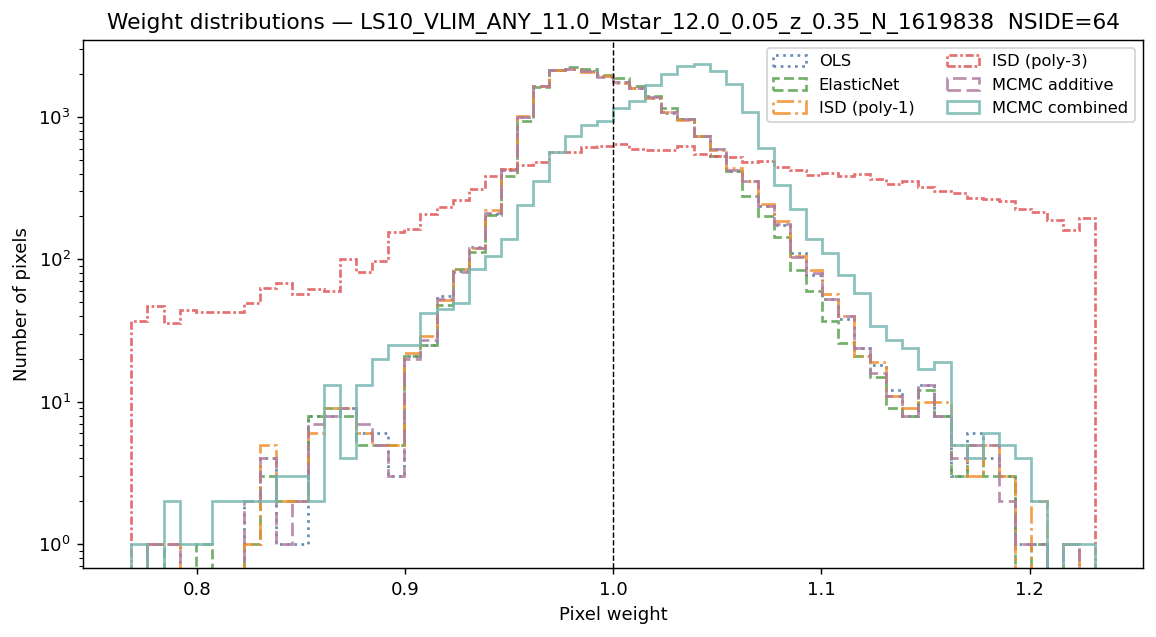
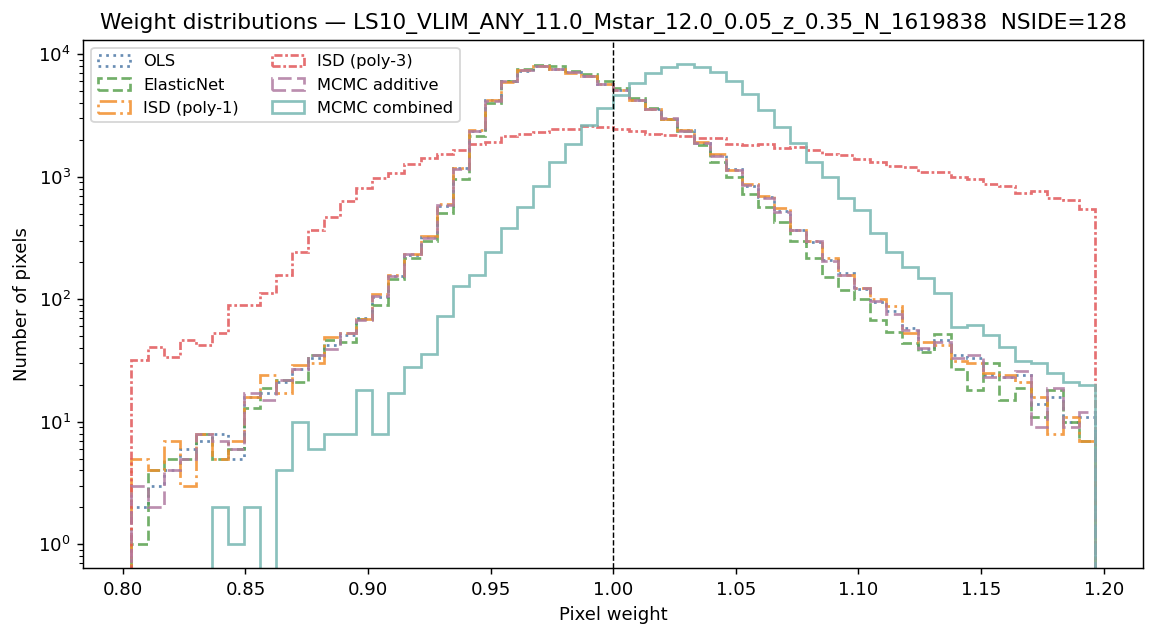
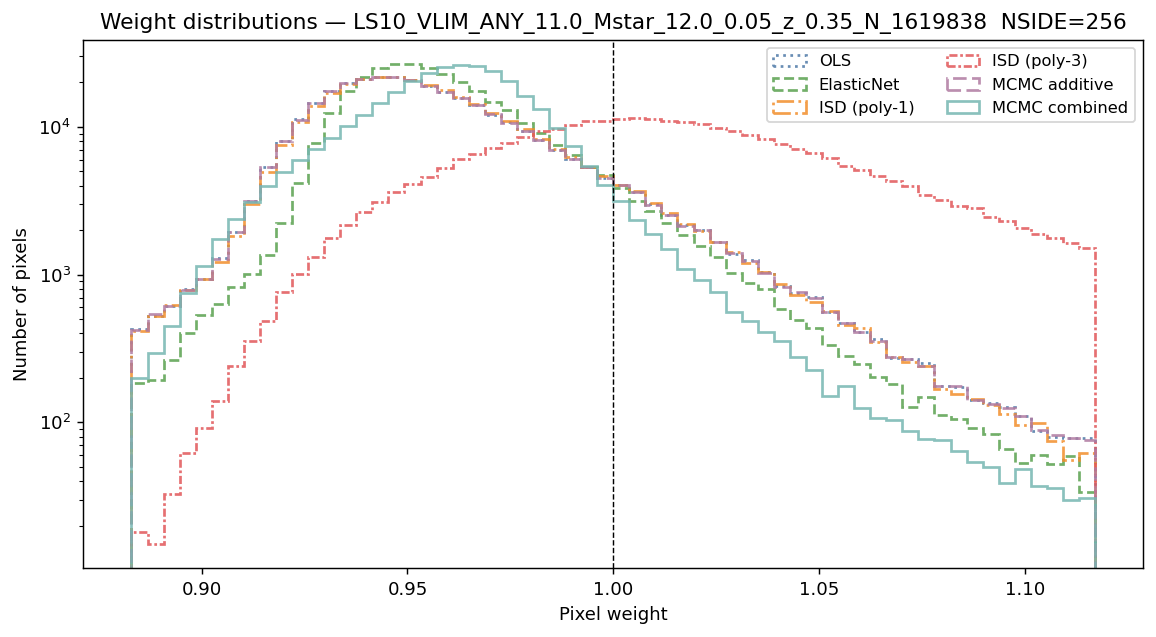
Systematic weight distributions
Narrow peaks near 1 indicate stable weight estimates. ElasticNet weights may be exactly 1 when cross-validation selects zero amplitudes.
Per-galaxy weight distributions — all six methods
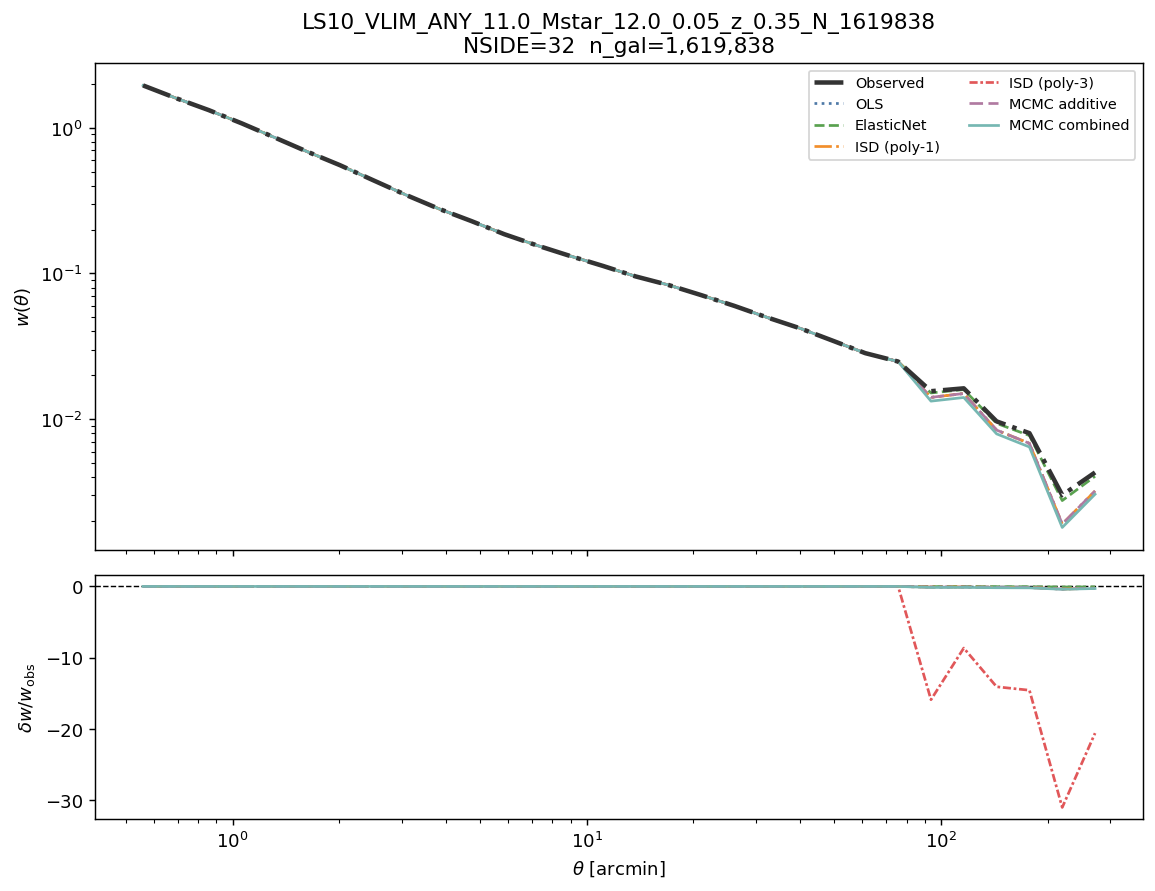
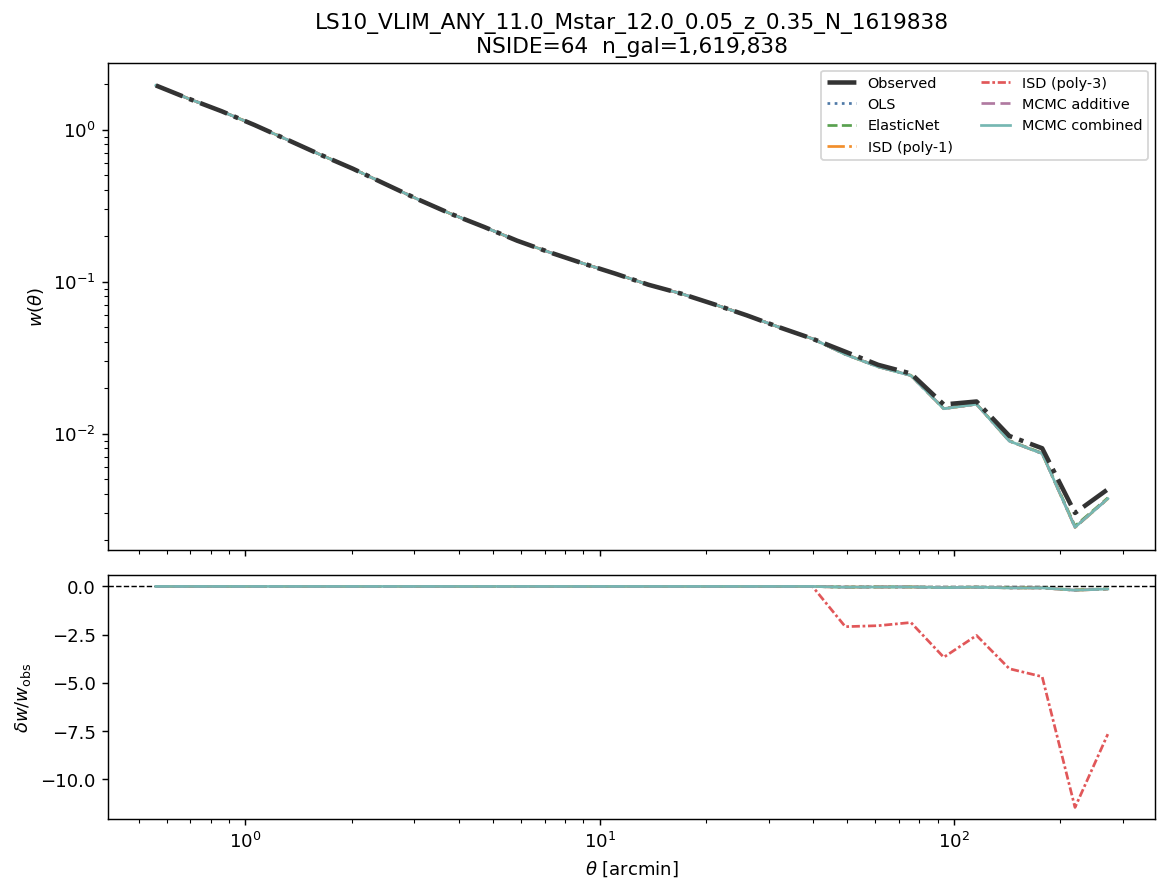
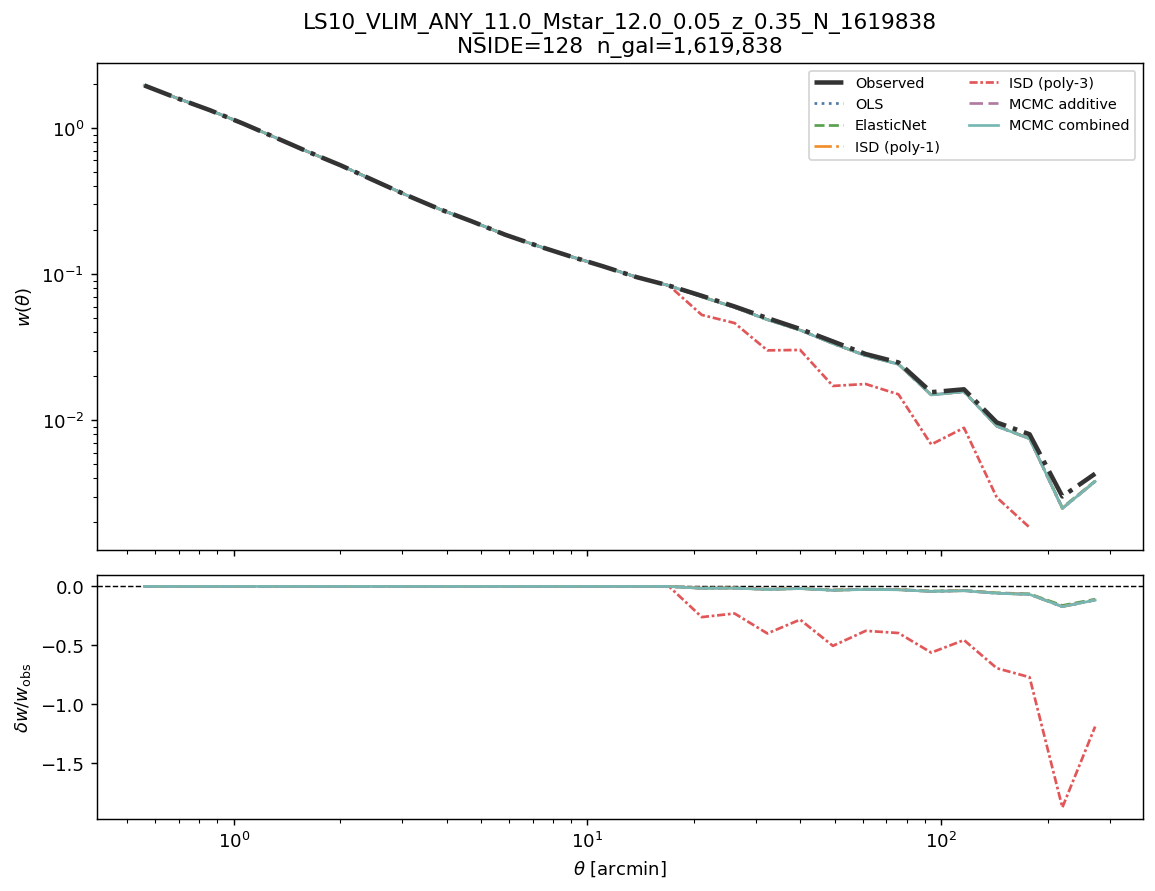
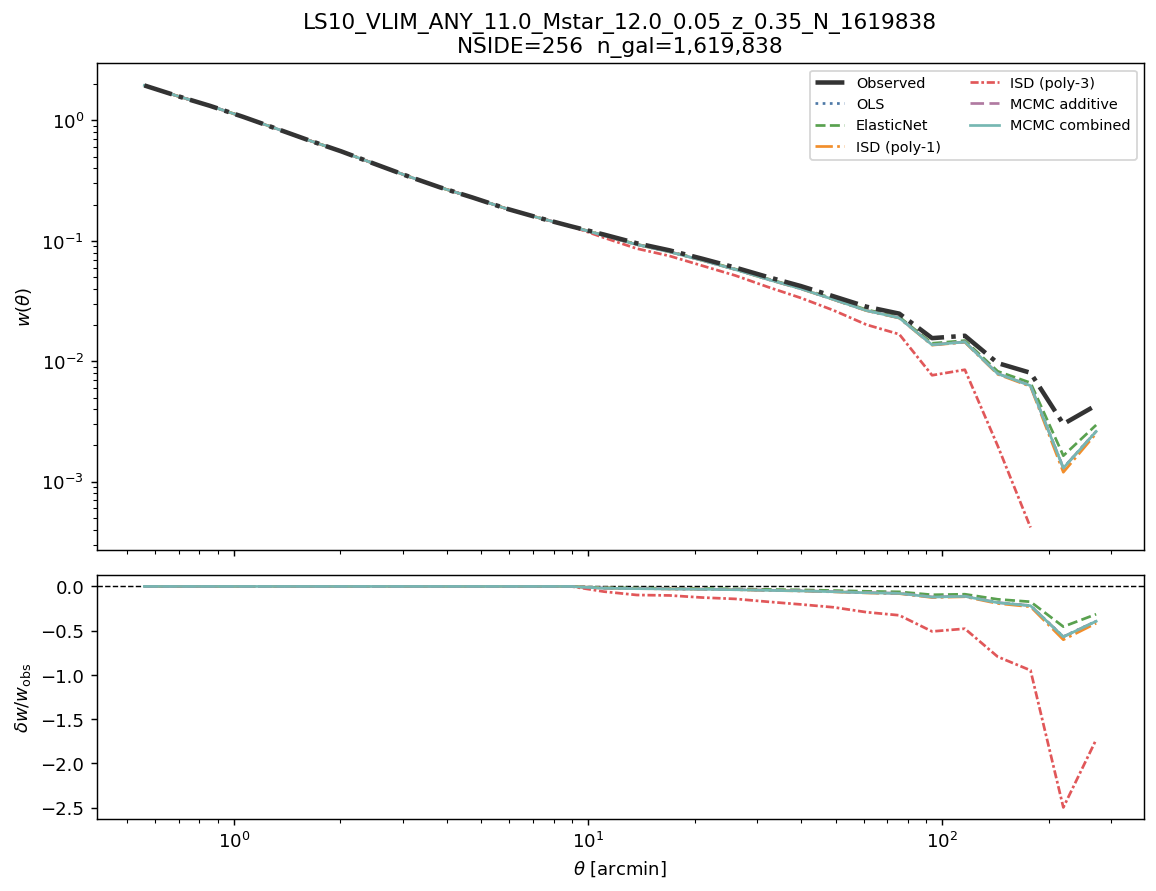
Angular clustering w(θ) before and after correction
Each panel shows the observed angular two-point correlation function (solid black) and the corrected \(w(\theta)\) for all six methods. A well-corrected sample shows suppressed excess clustering at all scales. Each panel corresponds to one map resolution.
w(θ): observed vs corrected — all six methods
Cosmological analysis verdict
Sub-degree scales (\(\theta < 30'\)): regime is sub-percent contamination (below noise floor) (\(\delta w/w \approx -0.1\%\) at 30 arcmin).
Without correction: suitable even without correction.
After correction: suitable — correction provides marginal improvement.
Large-angle warning (\(\theta > 2°\)): max correction 11.5% at 181 arcmin — any analysis using angular scales > 1° must apply
WEIGHT_COMB.
LRT (NSIDE 64): \(\lambda_{\rm LR} = 75.1\) (dof = 11), p = 1.3e-11 → Reject H₀ — multiplicative contamination is statistically detected.
Recommendation: use WEIGHT_COMB (WEIGHT_SYS) for all science-grade analyses.