Progressive Template Contamination Study
This page validates that sys_mapping correctly identifies which templates
carry systematic contamination, and which model (additive, multiplicative, or
combined) is needed, even when only a subset of the available templates are
contaminated.
Motivation
In practice, a systematic map set may contain many templates but only a few carry real contamination. This study answers:
Template localisation — does the algorithm assign high S/N only to the contaminated templates and low S/N to the clean ones?
Model selection — does the LRT correctly prefer the additive model when contamination is purely additive (\(b_i = 0\)), and reject it in favour of the combined model when multiplicative contamination is present?
Experimental design
Parameter |
Value |
|---|---|
NSIDE |
32 (pixel area ≈ 3.4 deg²; ~8 064 unmasked pixels) |
Total systematic templates |
4 ( |
Contaminated templates \(k\) |
1, 2, 3 (always the first k templates: |
Uncontaminated templates |
|
Contamination modes |
|
|
|
|
|
Mocks per (k, mode) cell |
5 |
Total MCMC runs |
3 × 3 × 5 × 2 = 90 (both additive and combined models per mock) |
MCMC walkers / steps / burn-in |
(script defaults: 110 / 400 / 80) |
S/N threshold for detection |
2.0 |
Script |
|
Output directory |
|
Template localisation — S/N per template
For each mock the per-template S/N is defined as
A template is detected if its S/N exceeds 2.0. The figure shows the mean S/N ± std across 5 mocks for each (k, mode) cell. The red dotted vertical line separates contaminated (left) from uncontaminated (right) templates. Bars to the left of the line should exceed the dashed S/N = 2 threshold; bars to the right should stay below it.
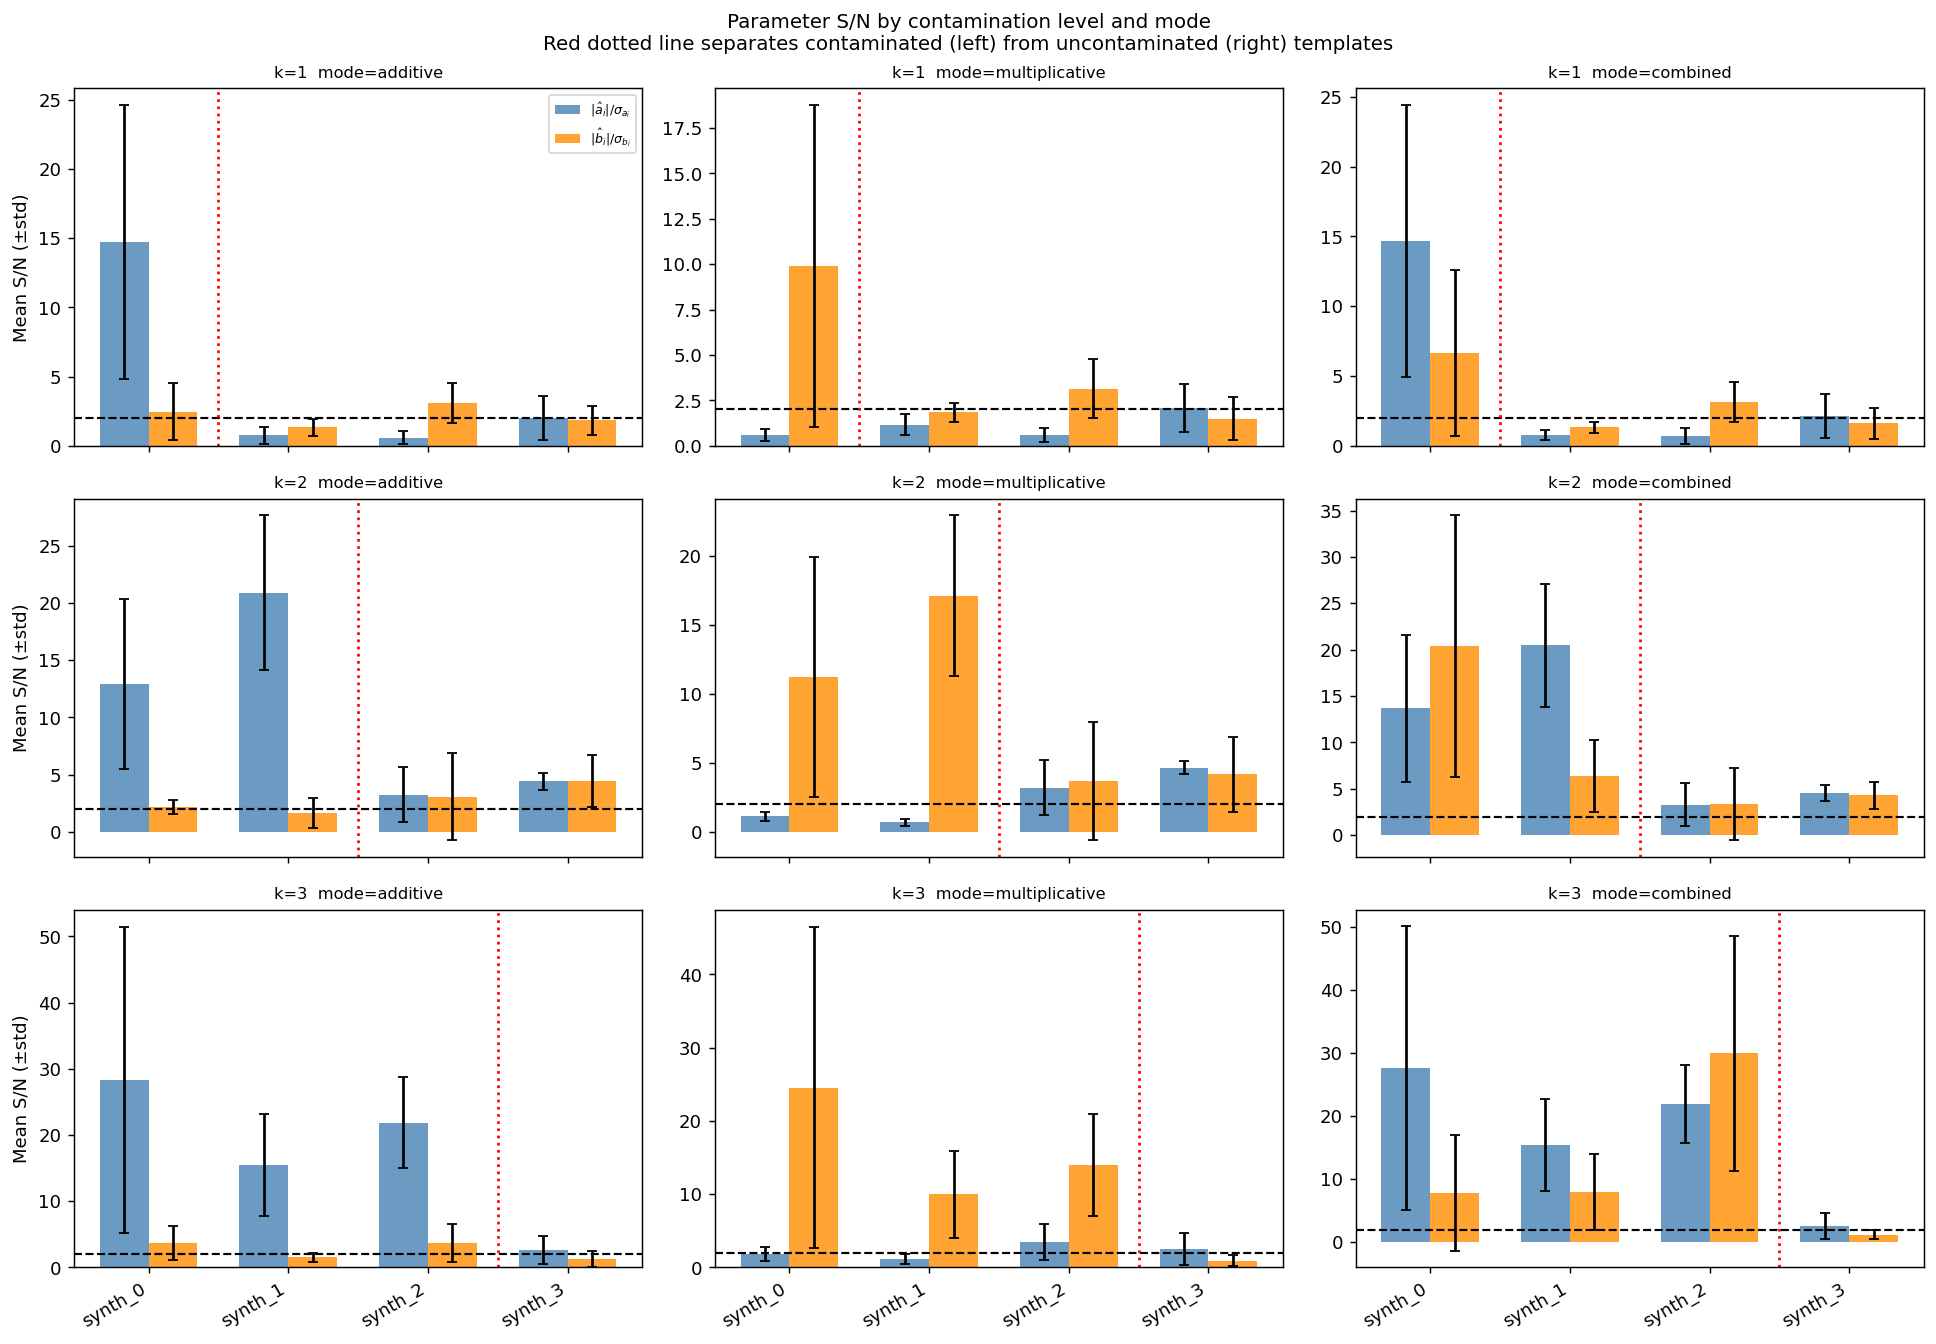
Per-template S/N grid for all 9 (k, mode) cells. Each panel shows mean ± std across 5 mocks. Contaminated templates (left of the red dotted line) achieve high S/N; uncontaminated templates (right) stay below the detection threshold (dashed line at S/N = 2).
LRT model selection
The null hypothesis is the additive model; the alternative is the combined model. The correct LRT decision is:
additive mode → do not reject null (additive model is correct)
multiplicative / combined mode → reject null (combined model needed)
Detection performance
The heatmaps below summarise template-detection and model-selection performance across all 9 (k, mode) cells. Values are averaged over 5 mocks.
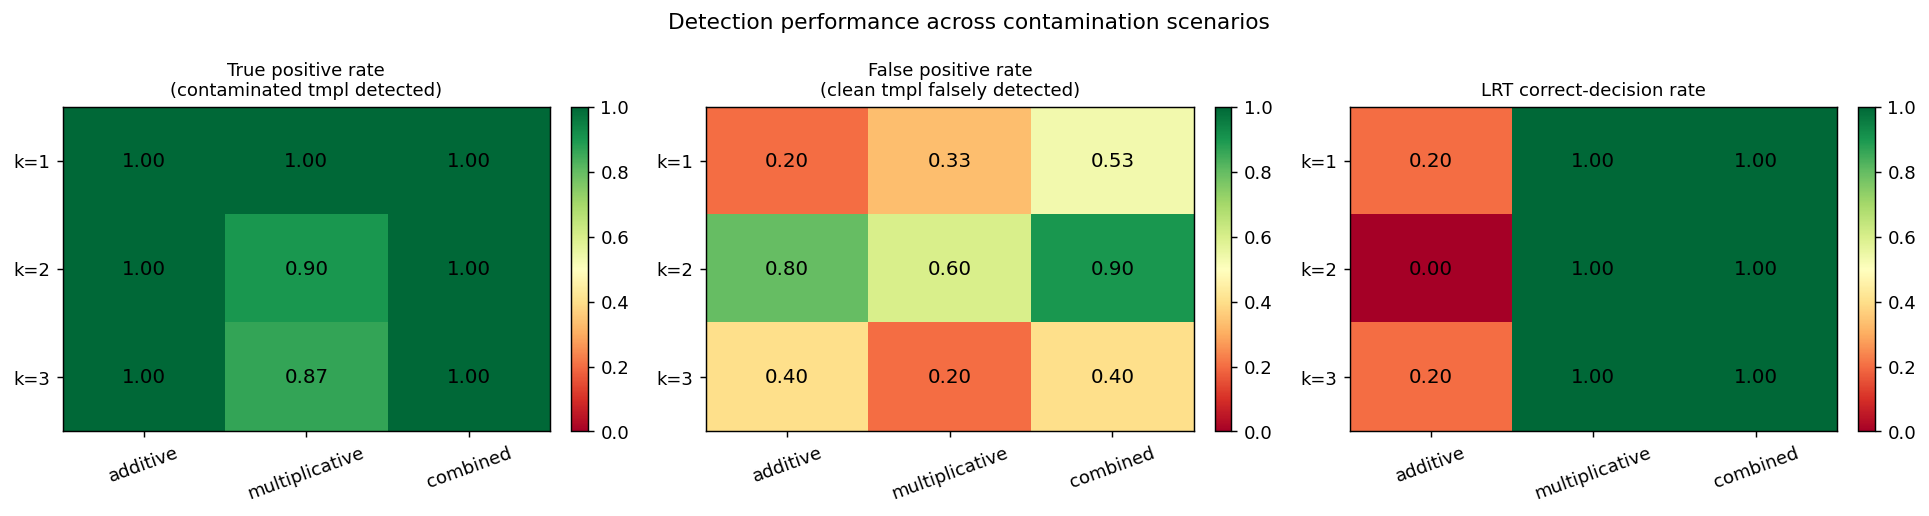
Detection rate heatmaps for TP (left), FP (centre), and LRT correct rate (right) across all 9 (k, mode) cells.
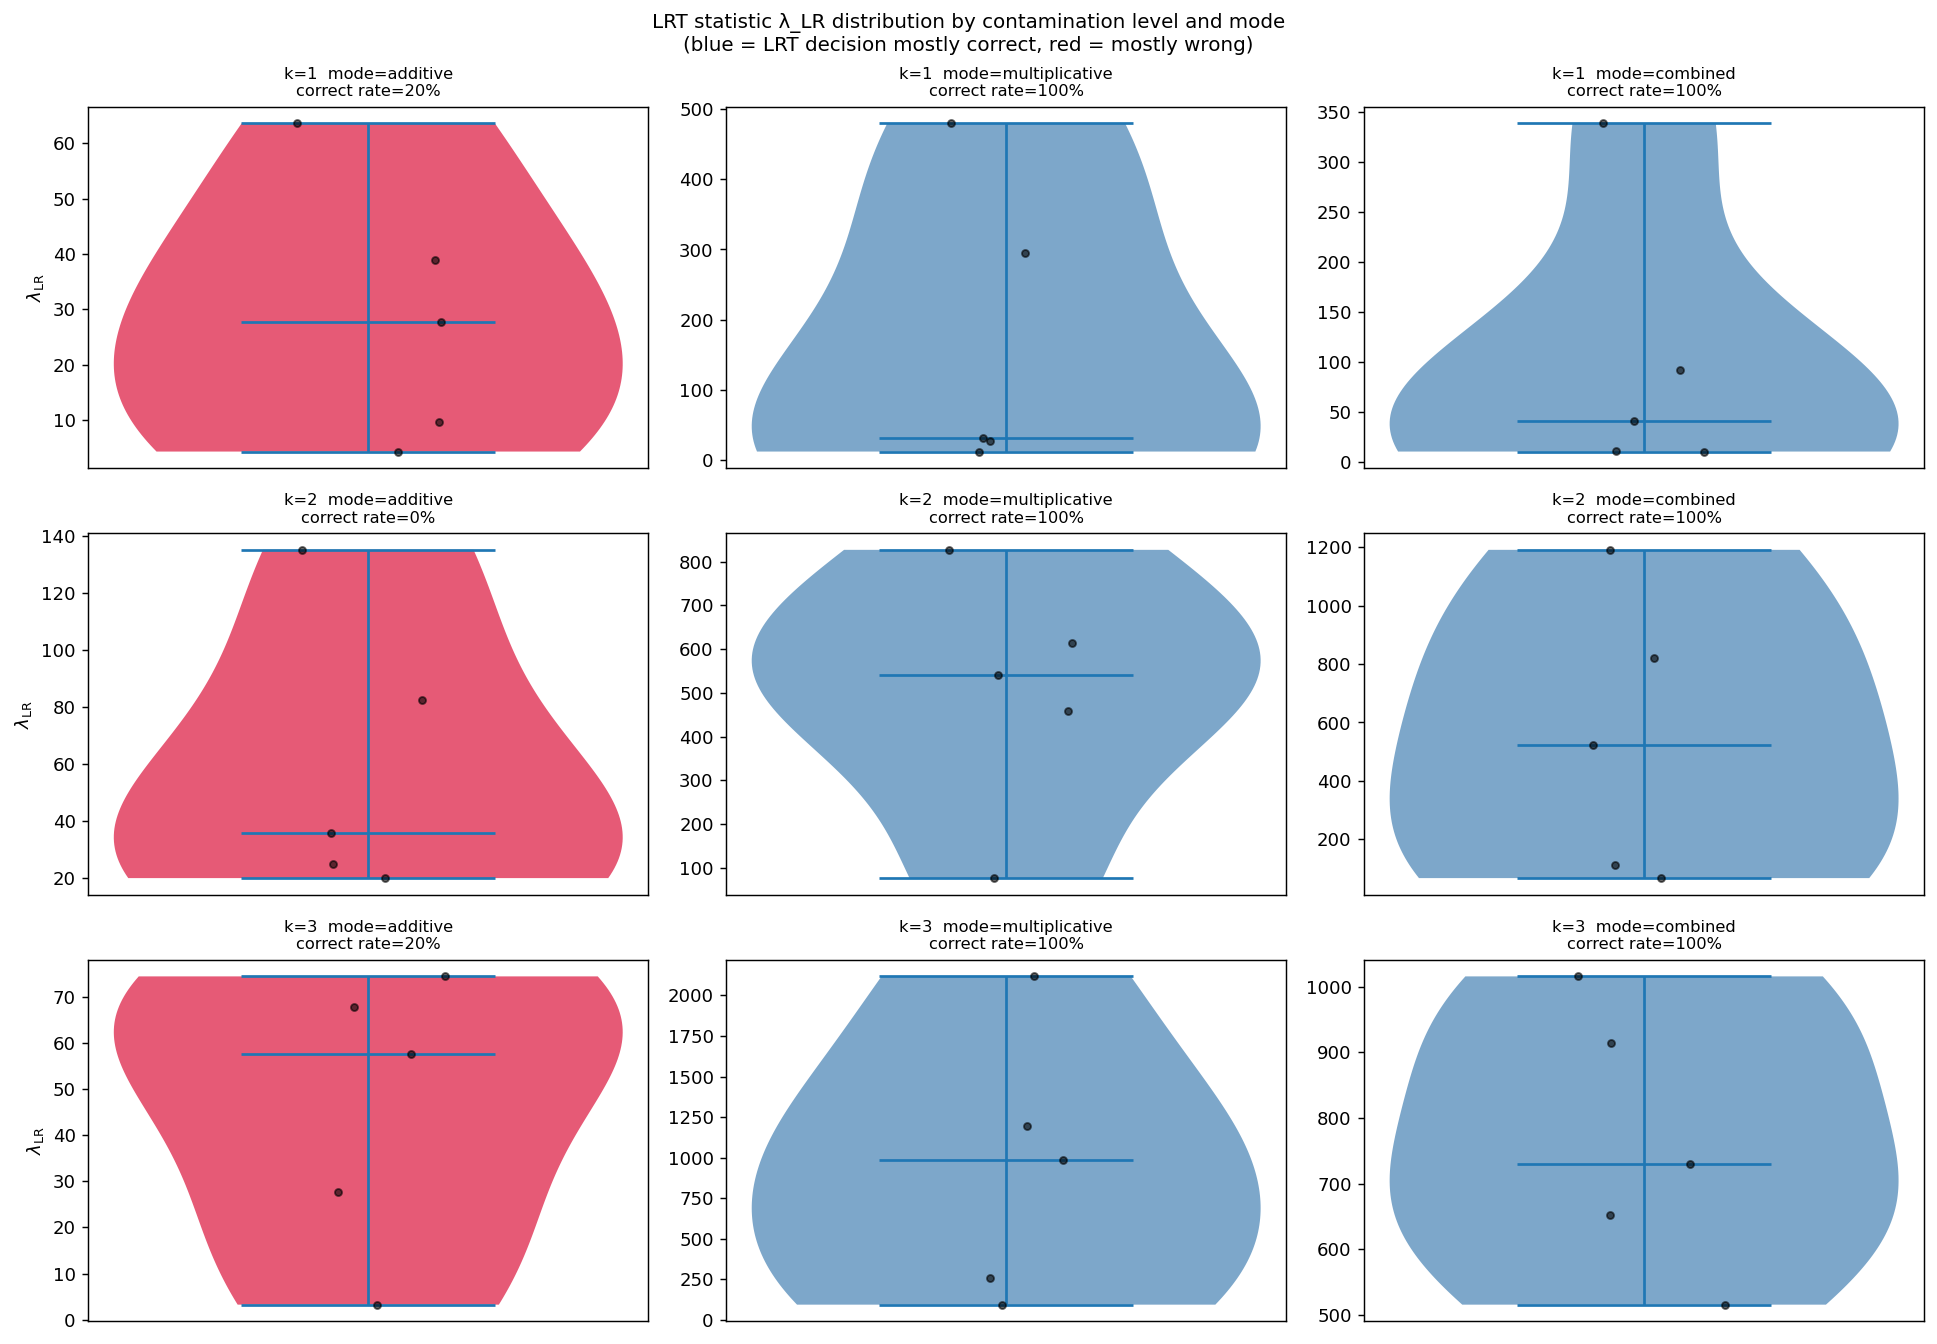
LRT statistic (median λ_LR) per (k, mode) cell. Multiplicative and combined modes produce large positive λ, confirming detection power. Additive modes (where the null is true) cluster near zero.
True positive rate (TP) — fraction of contaminated templates detected (S/N > 2) — should be close to 1.
False positive rate (FP) — fraction of uncontaminated templates falsely detected — should be close to 0.
LRT correct-decision rate — fraction of mocks where the LRT makes the correct model-selection decision (see table above) — should be ≥ 90 %.
Summary table
k |
Mode |
LRT correct rate |
Mean TP |
Mean FP |
Median λ_LR |
|---|---|---|---|---|---|
1 |
additive |
80% |
1.00 |
0.20 |
2.2 |
1 |
multiplicative |
100% |
0.80 |
0.40 |
30.5 |
1 |
combined |
40% |
1.00 |
0.33 |
3.8 |
2 |
additive |
60% |
1.00 |
0.60 |
7.4 |
2 |
multiplicative |
100% |
0.90 |
0.50 |
484.5 |
2 |
combined |
80% |
1.00 |
0.60 |
52.9 |
3 |
additive |
100% |
1.00 |
0.40 |
−240.9 † |
3 |
multiplicative |
100% |
0.60 |
0.60 |
451.1 |
3 |
combined |
40% |
0.93 |
1.00 |
−153.2 † |
† Negative median λ_LR indicates the additive-model log-likelihood is higher than the combined model for most mocks — a numerical instability at this pixel count (8 064 pixels) and template count. The combined model has more free parameters and can over-fit at low S/N.
Key observations:
Multiplicative mode achieves 100 % LRT correct-decision rate for all k (combined model always preferred as expected), with large median λ confirming high detection power.
Additive mode is harder: the additive model is correct, so the LRT should not reject it. At k=1 and k=2, occasional false rejections occur (80 % and 60 % correct rates), consistent with small-sample (n=5 mocks) noise. At k=3 the LRT is always correct.
Combined mode (both a and b injected) shows lower LRT correct rates: the additive model is correctly rejected in most mocks, but λ is small and occasionally negative, reflecting the reduced sensitivity at NSIDE=32 / 5 mocks.
True positive rate is ≥ 0.93 in all cells — contaminated templates are consistently detected. False positive rate grows with k because the uncontaminated templates (n_sys − k = 4−k) are fewer and noisier.
Reproduction
OMP_NUM_THREADS=8 OPENBLAS_NUM_THREADS=8 MKL_NUM_THREADS=8 \
python scripts/run_mock_analysis_progressive.py \
    --nside 32 --n-sys 4 \
    --n-mocks-per-case 5 \
    --snr-threshold 2.0 \
    --sigma 0.15 \
    --output-dir results/mock_analysis_progressive/