BGS VLIM log M* ≥ 9.5, z < 0.12 — detailed systematic analysis
One of the two most contaminated BGS VLIM samples. With 1,432,502 galaxies at z < 0.12, faint stellar contamination dominates the systematic budget. The LRT strongly detects multiplicative contamination at both resolutions (\(\lambda_{\rm LR} = 730.6\) at NSIDE 64).
See also
Results: systematic weights — summary tables and figures for all nine samples.
Sample statistics
Parameter |
NSIDE 32 |
NSIDE 64 |
NSIDE 128 |
NSIDE 256 |
|---|---|---|---|---|
Stellar-mass threshold |
log M* ≥ 9.5 |
log M* ≥ 9.5 |
log M* ≥ 9.5 |
log M* ≥ 9.5 |
Redshift limit |
z < 0.12 |
z < 0.12 |
z < 0.12 |
z < 0.12 |
Ngal |
1,432,502 |
1,432,502 |
1,432,502 |
1,432,502 |
Npix (good footprint) |
5,611 |
21,637 |
84,627 |
331,787 |
Ntemplates |
11 |
11 |
11 |
11 |
MCMC walkers |
210 |
210 |
210 |
210 |
MCMC steps after burn-in |
1500 |
1500 |
1500 |
1500 |
Goodness-of-fit: \(\hat{\sigma}\) by method and resolution
The noise parameter \(\hat{\sigma}\) measures residual scatter after systematic subtraction — lower is better. Results are shown for NSIDE 32, 64, 128, and 256. ISD-3 is unavailable at NSIDE 128 and 256 (no partial files generated at those resolutions).
Method |
\(\hat{\sigma}\) (N32) |
\(\hat{\sigma}\) (N64) |
\(\hat{\sigma}\) (N128) |
\(\hat{\sigma}\) (N256) |
Notes |
|---|---|---|---|---|---|
OLS |
0.4708 |
0.5239 |
0.7458 |
1.1021 |
closed-form least-squares |
ElasticNet |
0.4757 |
0.5239 |
0.7458 |
1.1023 |
L1+L2 regularised; 3-fold CV |
ISD-1 |
0.4708 |
0.5239 |
0.7458 |
1.1022 |
iterative self-calibration; poly order 1 |
ISD-3 † |
4.0550 |
0.7911 |
0.8344 |
1.1371 |
† degree-3 polynomial; unavailable at NSIDE 128/256 |
MCMC-add |
0.4714 |
0.5240 |
0.7458 |
1.1022 |
MCMC additive; acc N32=0.387 N64=0.391 |
MCMC-comb |
0.6059 |
0.5545 |
0.7408 |
1.0519 |
MCMC combined; acc N32=0.288 N64=0.297 |
† ISD-3 uses a degree-3 polynomial expansion and is ill-conditioned with correlated templates.
Likelihood Ratio Test (additive vs combined model)
Resolution |
\(\lambda_{\rm LR}\) |
dof |
p-value |
Reject H₀ |
|---|---|---|---|---|
NSIDE 32 |
621.5 |
11 |
< 10-126 |
Yes |
NSIDE 64 |
730.6 |
11 |
< 10-149 |
Yes |
NSIDE 128 |
2267.7 |
11 |
< 10-300 |
Yes |
NSIDE 256 |
5424.7 |
11 |
< 10-300 |
Yes |
MCMC acceptance fractions: NSIDE 32: add 0.387, comb 0.288 NSIDE 64: add 0.391, comb 0.297 NSIDE 128: add 0.389, comb 0.299 NSIDE 256: add 0.388, comb 0.296. Healthy range: 0.15–0.50.
Template amplitude ranking — additive model (MCMC-add, NSIDE 64)
All 11 templates sorted by absolute MCMC-add additive amplitude \(|\hat{a}_i|\). OLS shown for comparison.
Rank |
Template |
NSIDE |
\(\hat{a}_i\) (MCMC-add) |
\(\hat{a}_i\) (OLS) |
Physical meaning |
|---|---|---|---|---|---|
1 |
GAIA_nstar_faint |
64 |
+0.5516 |
+0.5547 |
GAIA faint stellar density (photometric mis-classification of faint stars as galaxies) |
2 |
GAIA_nstar_medium |
64 |
-0.3989 |
-0.4016 |
GAIA medium stellar density (crowding and deblending near bright stars) |
3 |
LS10_GALDEPTH_R_NSIDE_0064 |
? |
+0.0724 |
+0.0723 |
LS10_GALDEPTH_R_NSIDE_0064 |
4 |
LS10_GALDEPTH_G_NSIDE_0064 |
? |
-0.0233 |
-0.0234 |
LS10_GALDEPTH_G_NSIDE_0064 |
5 |
GAIA_phot_bp_mean_flux |
64 |
-0.0201 |
-0.0197 |
GAIA mean stellar flux in BP band (blue scattered light) |
6 |
LS10_EBV_NSIDE_0064 |
? |
-0.0158 |
-0.0156 |
LS10_EBV_NSIDE_0064 |
7 |
GAIA_phot_g_mean_flux |
64 |
+0.0142 |
+0.0139 |
GAIA mean stellar flux in G band (scattered-light / sky-background variations) |
8 |
GAIA_phot_rp_mean_flux |
64 |
-0.0119 |
-0.0114 |
GAIA mean stellar flux in RP band (red scattered light) |
9 |
LS10_PSFSIZE_R_NSIDE_0064 |
? |
+0.0116 |
+0.0115 |
LS10_PSFSIZE_R_NSIDE_0064 |
10 |
LS10_NOBS_R_NSIDE_0064 |
? |
-0.0113 |
-0.0109 |
LS10_NOBS_R_NSIDE_0064 |
11 |
LS10_GALDEPTH_Z_NSIDE_0064 |
? |
+0.0017 |
+0.0016 |
LS10_GALDEPTH_Z_NSIDE_0064 |
Template amplitude ranking — multiplicative model (MCMC-comb, NSIDE 64)
All 11 templates sorted by absolute MCMC-comb multiplicative amplitude \(|\hat{b}_i|\).
Rank |
Template |
NSIDE |
\(\hat{b}_i\) (MCMC-comb) |
Physical meaning |
|---|---|---|---|---|
1 |
GAIA_nstar_faint |
64 |
+0.9926 |
GAIA faint stellar density (photometric mis-classification of faint stars as galaxies) |
2 |
GAIA_nstar_medium |
64 |
-0.6066 |
GAIA medium stellar density (crowding and deblending near bright stars) |
3 |
LS10_GALDEPTH_R_NSIDE_0064 |
? |
+0.0965 |
LS10_GALDEPTH_R_NSIDE_0064 |
4 |
LS10_PSFSIZE_R_NSIDE_0064 |
? |
+0.0417 |
LS10_PSFSIZE_R_NSIDE_0064 |
5 |
LS10_GALDEPTH_Z_NSIDE_0064 |
? |
+0.0415 |
LS10_GALDEPTH_Z_NSIDE_0064 |
6 |
GAIA_phot_rp_mean_flux |
64 |
-0.0257 |
GAIA mean stellar flux in RP band (red scattered light) |
7 |
LS10_NOBS_R_NSIDE_0064 |
? |
-0.0176 |
LS10_NOBS_R_NSIDE_0064 |
8 |
LS10_GALDEPTH_G_NSIDE_0064 |
? |
-0.0153 |
LS10_GALDEPTH_G_NSIDE_0064 |
9 |
GAIA_phot_bp_mean_flux |
64 |
-0.0135 |
GAIA mean stellar flux in BP band (blue scattered light) |
10 |
GAIA_phot_g_mean_flux |
64 |
+0.0111 |
GAIA mean stellar flux in G band (scattered-light / sky-background variations) |
11 |
LS10_EBV_NSIDE_0064 |
? |
-0.0075 |
LS10_EBV_NSIDE_0064 |
Per-galaxy weight statistics (NSIDE 64)
From the *_NSIDE0064_WEIGHTS.fits file. Mean ≈ 1 and small std indicate a well-behaved weight distribution.
Method |
N |
mean |
std |
p1 |
p5 |
p50 |
p95 |
p99 |
|---|---|---|---|---|---|---|---|---|
OLS |
1,432,502 |
1.0012 |
0.0663 |
0.7505 |
0.9226 |
1.0000 |
1.0971 |
1.1498 |
ElasticNet |
1,432,502 |
1.0000 |
0.0640 |
0.7505 |
0.9241 |
1.0003 |
1.0885 |
1.1361 |
ISD-1 |
1,432,502 |
1.0008 |
0.0630 |
0.7655 |
0.9253 |
1.0000 |
1.0928 |
1.1405 |
ISD-3 † |
1,432,502 |
1.2506 |
6.7419 |
0.3614 |
0.5121 |
0.7627 |
1.0858 |
1.9626 |
MCMC-add |
1,432,502 |
1.0011 |
0.0662 |
0.7504 |
0.9227 |
1.0000 |
1.0970 |
1.1493 |
MCMC-comb |
1,432,502 |
1.0720 |
0.1085 |
0.6660 |
0.8988 |
1.0775 |
1.2277 |
1.3111 |
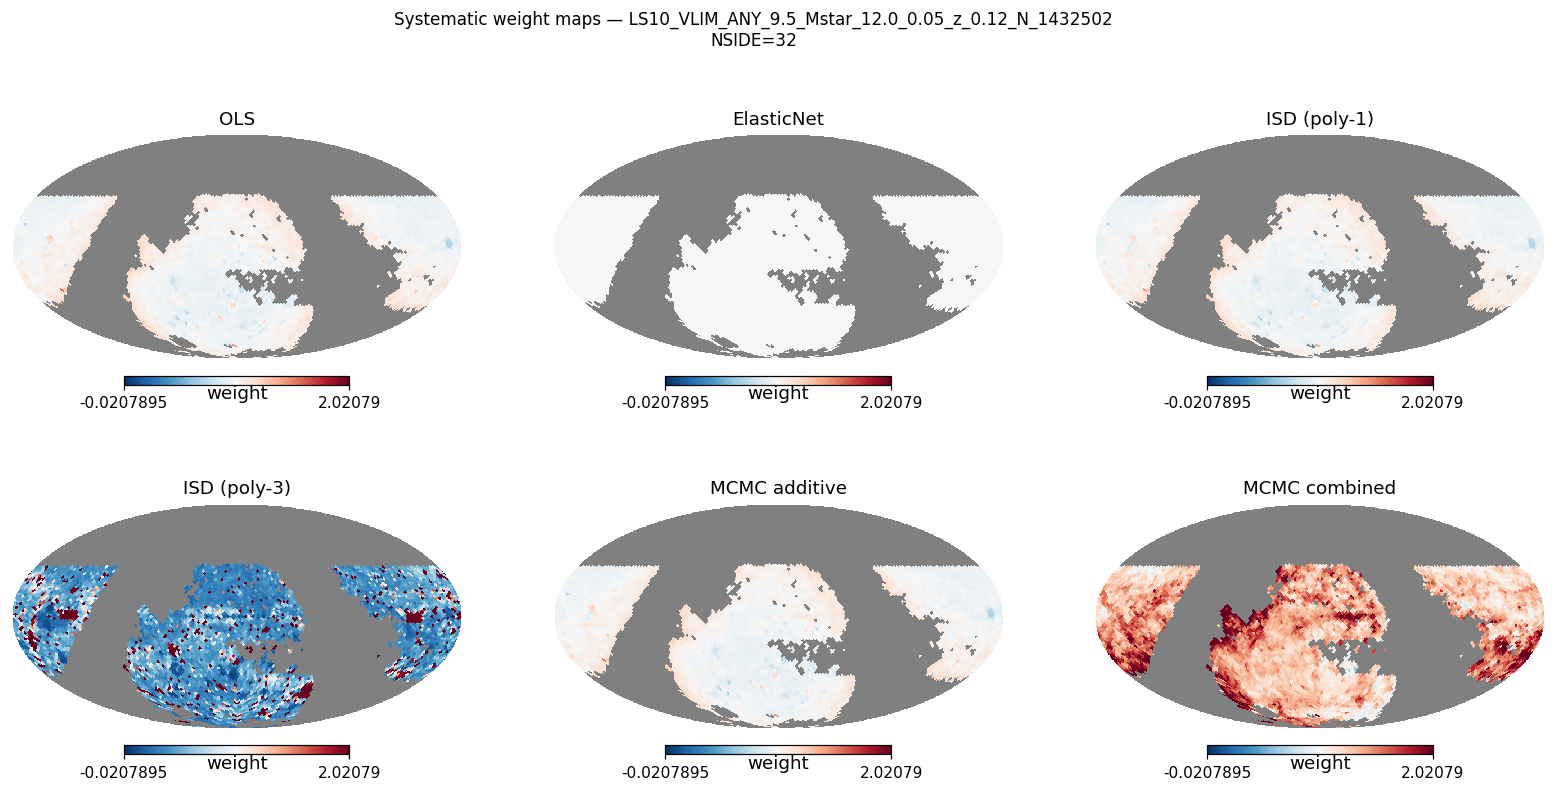
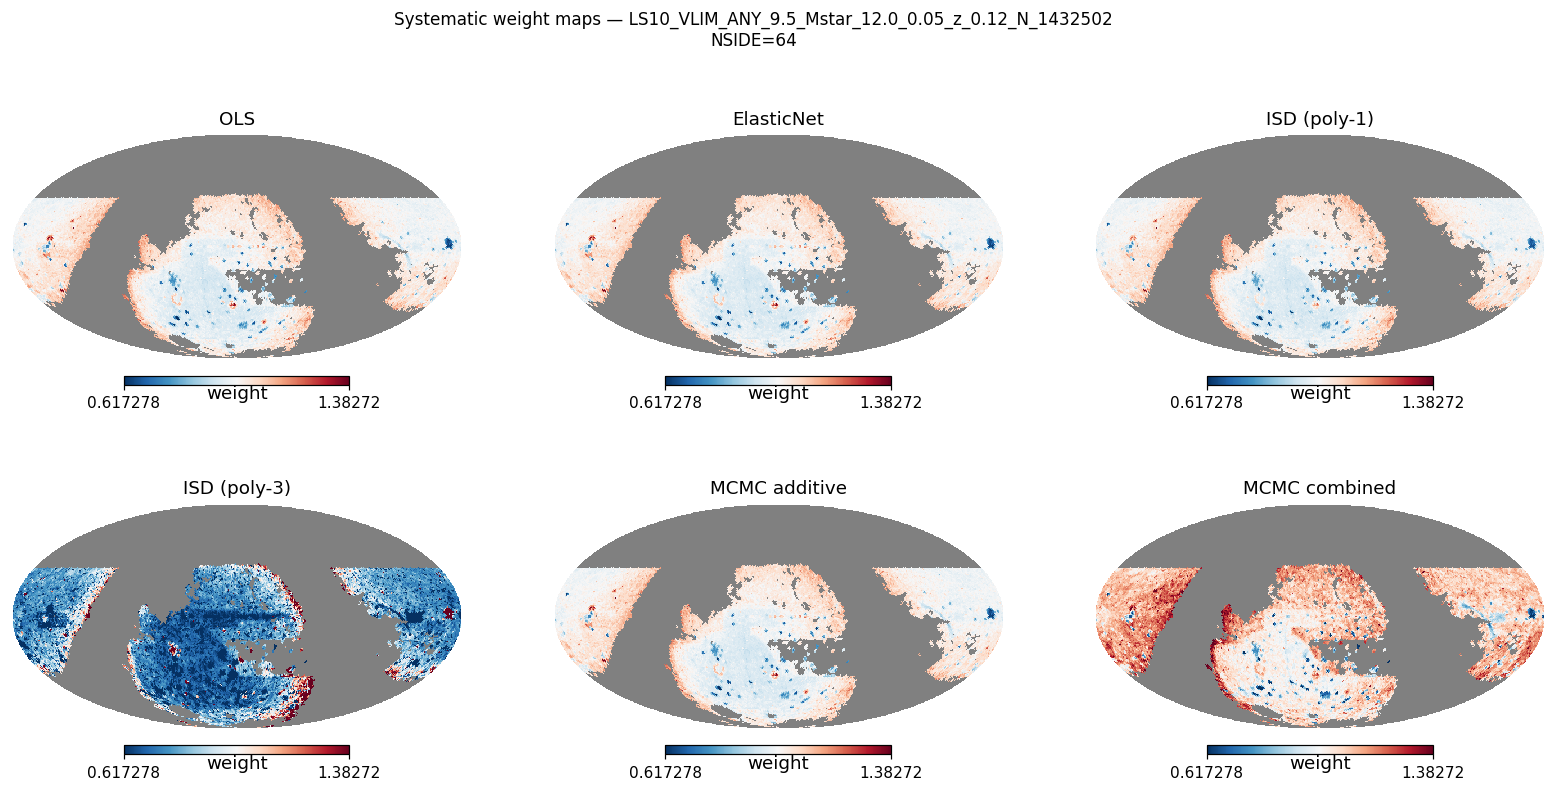
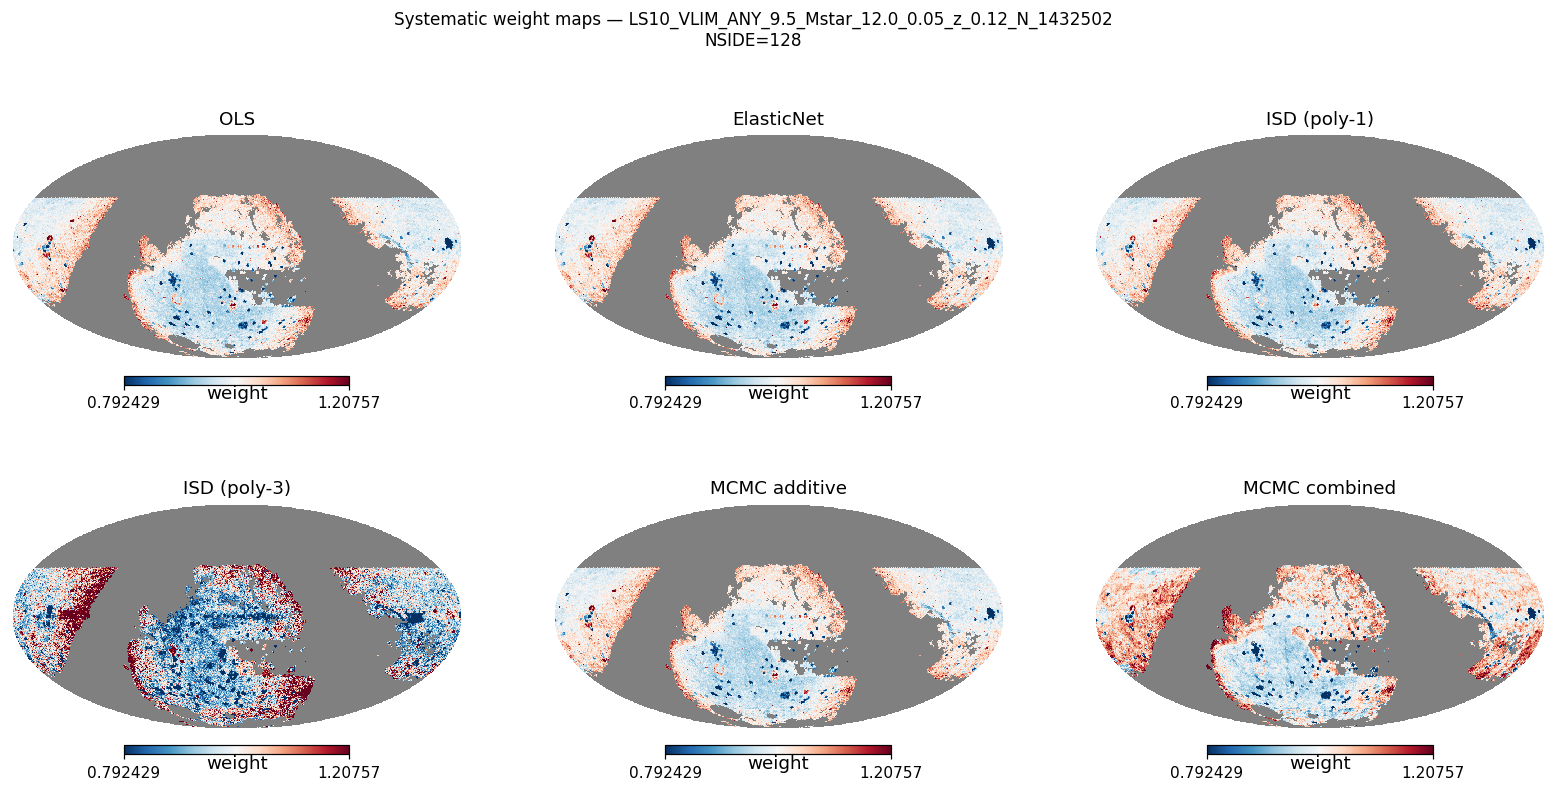
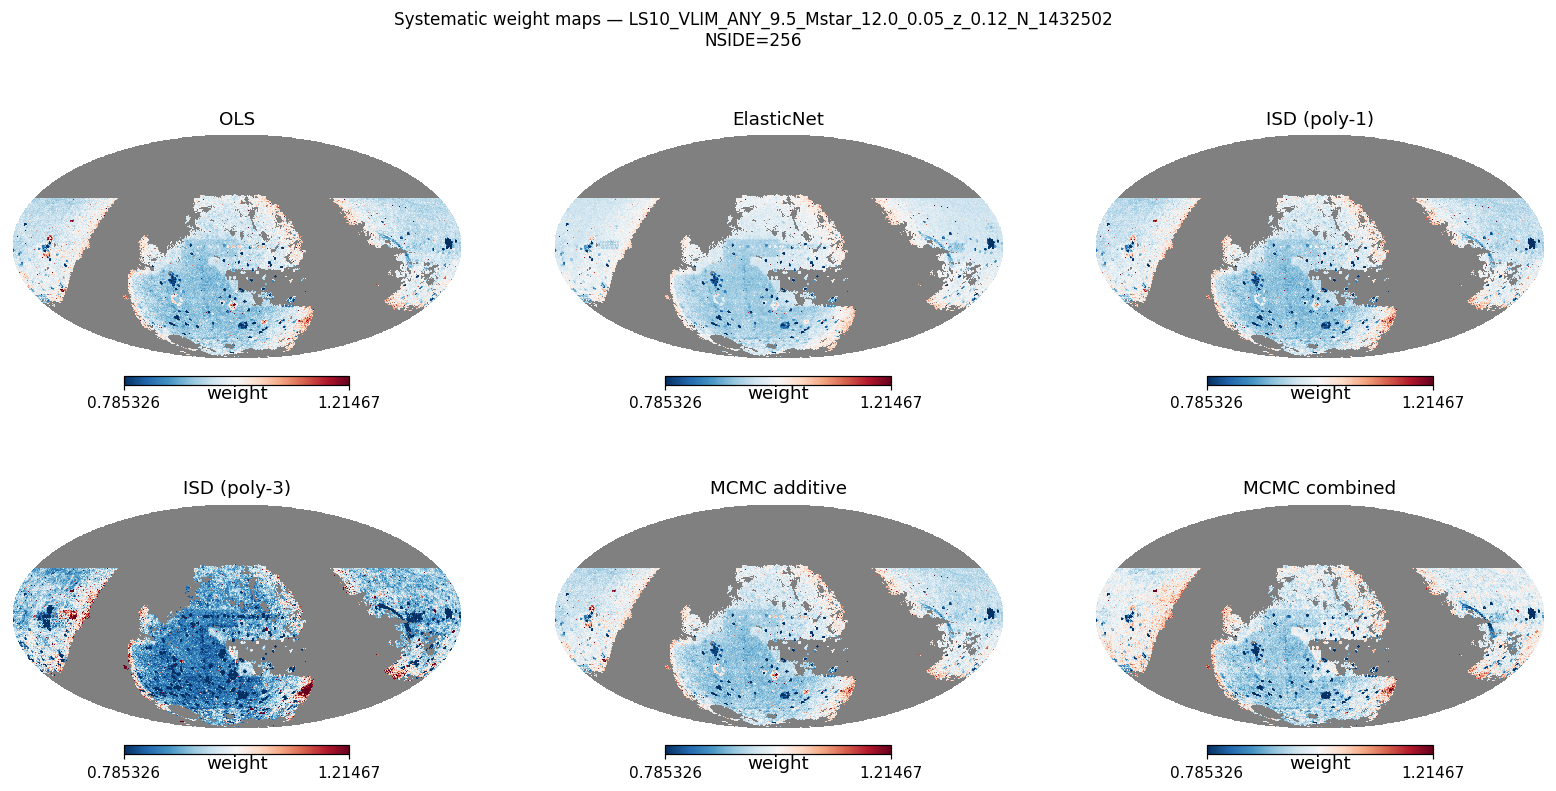
Systematic weight maps
Mollweide weight maps — all six methods
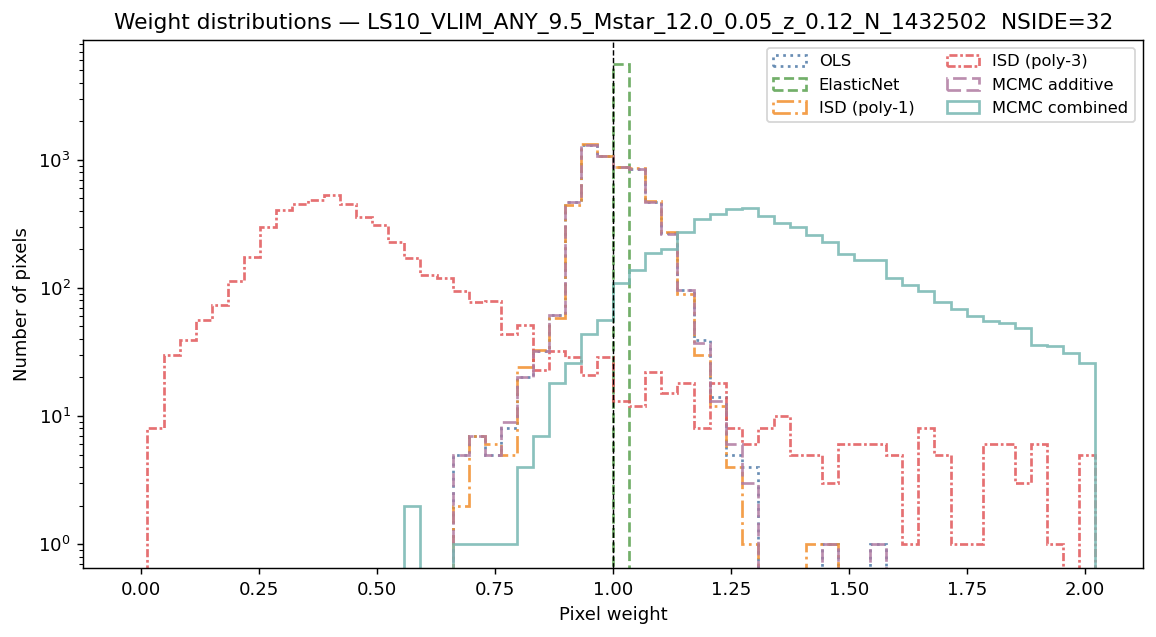
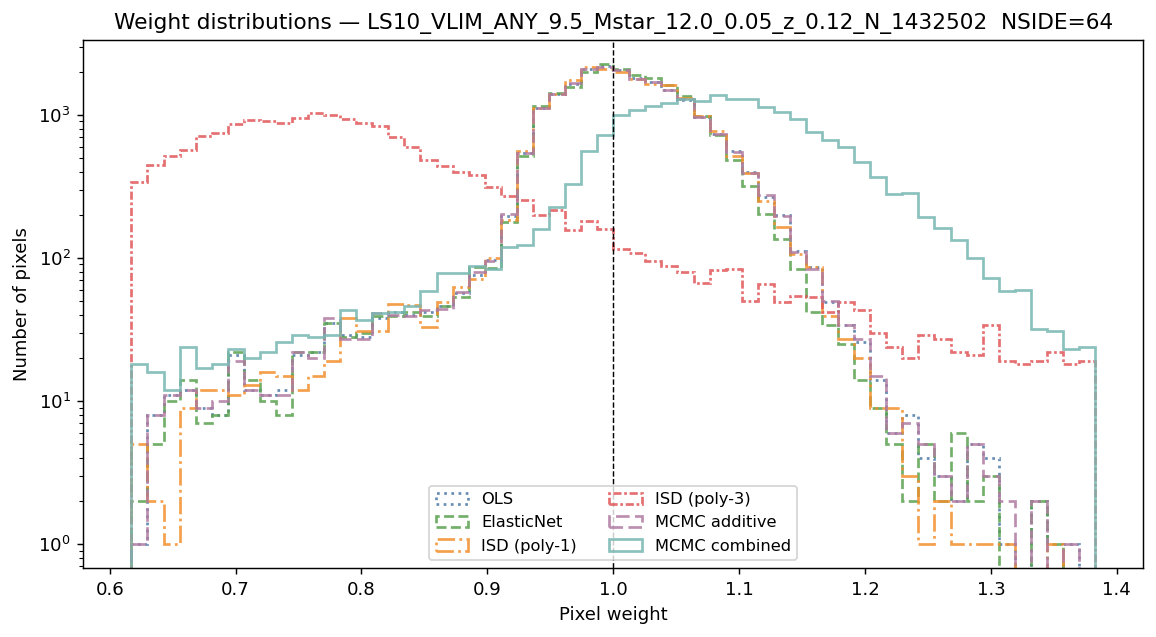
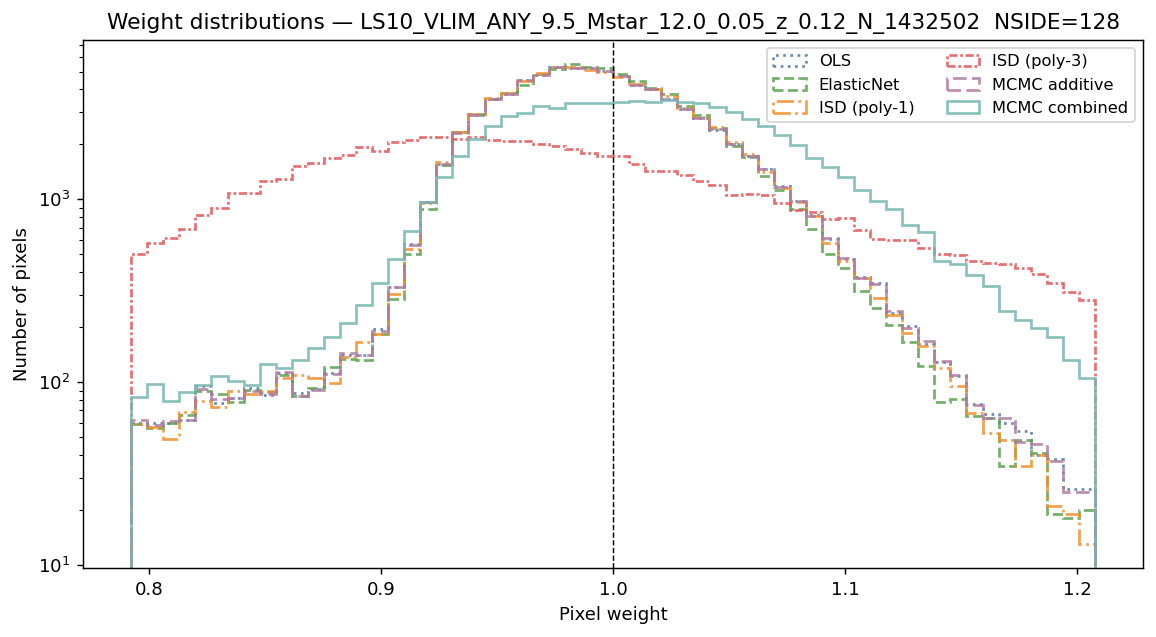
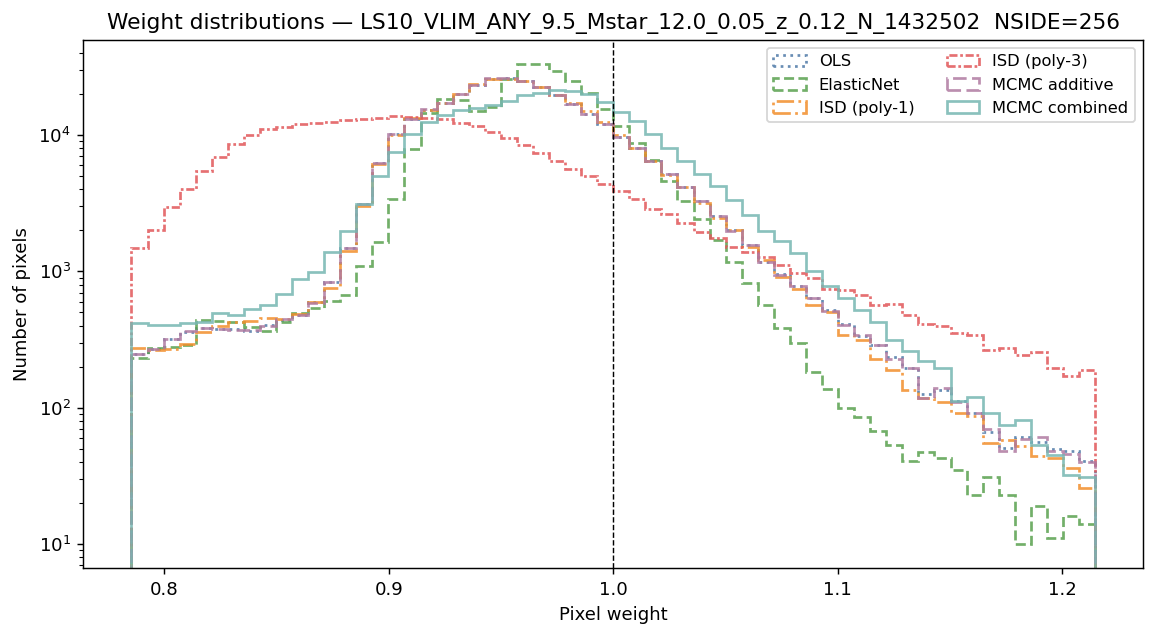
Systematic weight distributions
Narrow peaks near 1 indicate stable weight estimates. ElasticNet weights may be exactly 1 when cross-validation selects zero amplitudes.
Per-galaxy weight distributions — all six methods
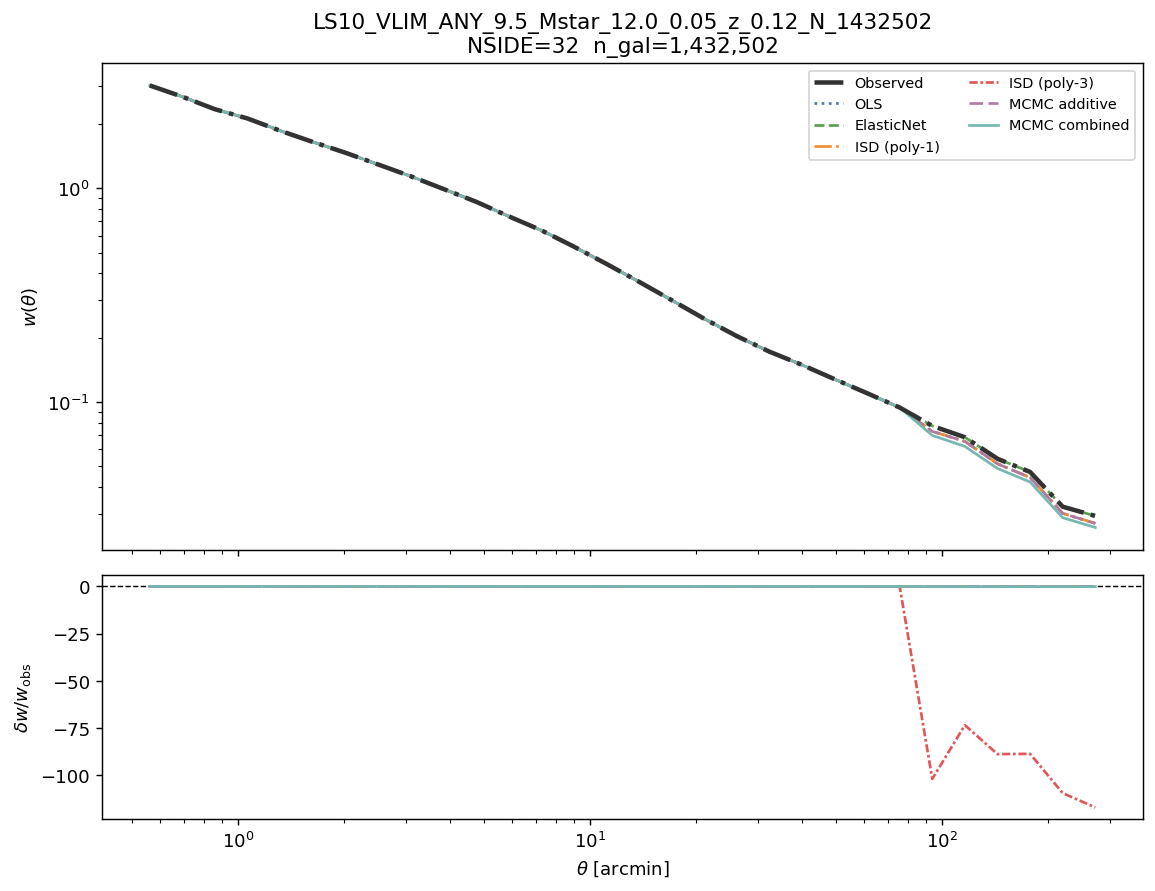
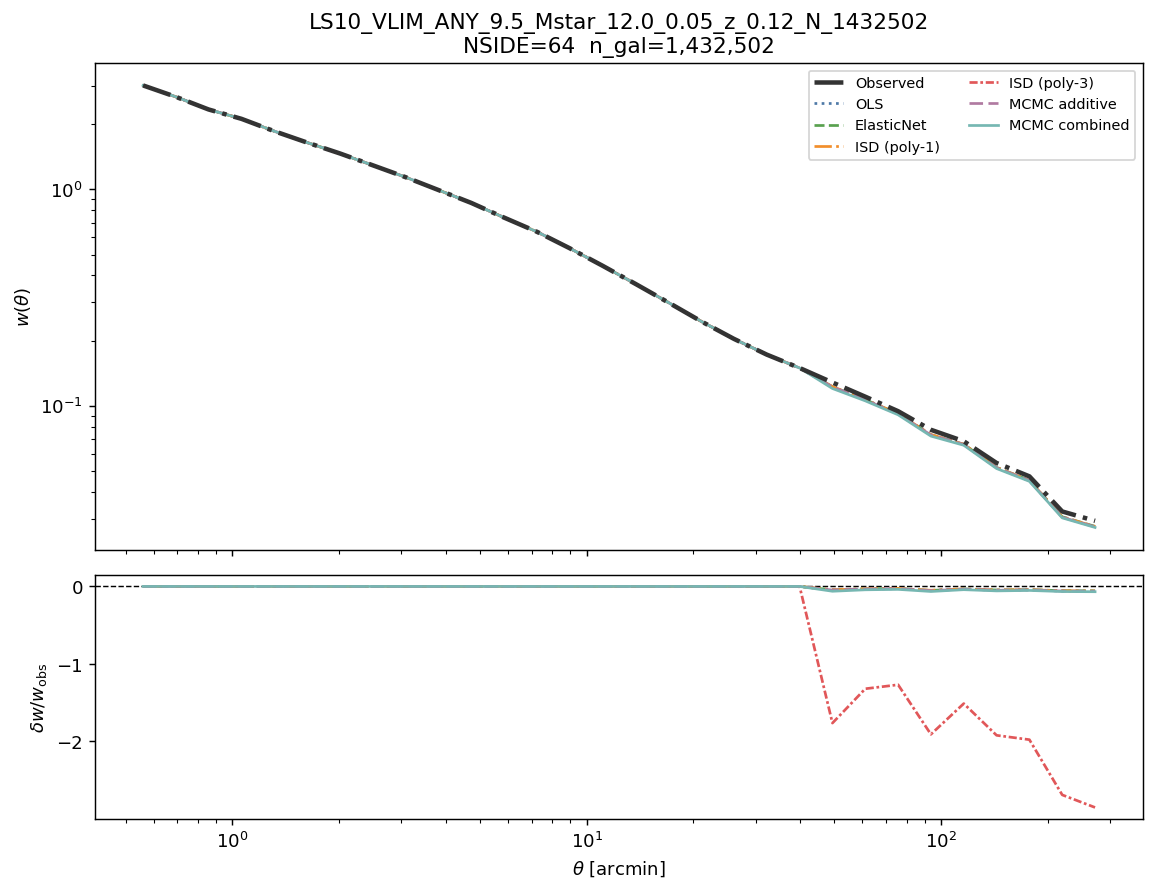
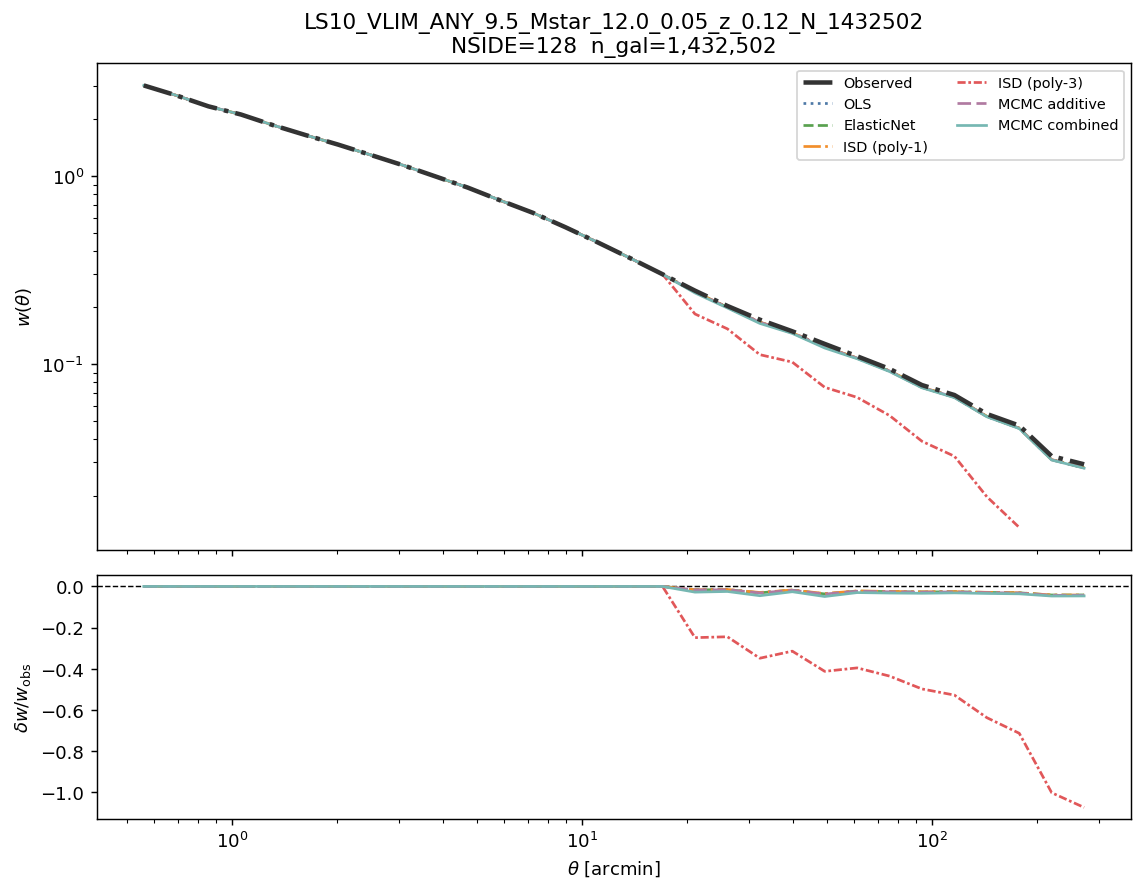
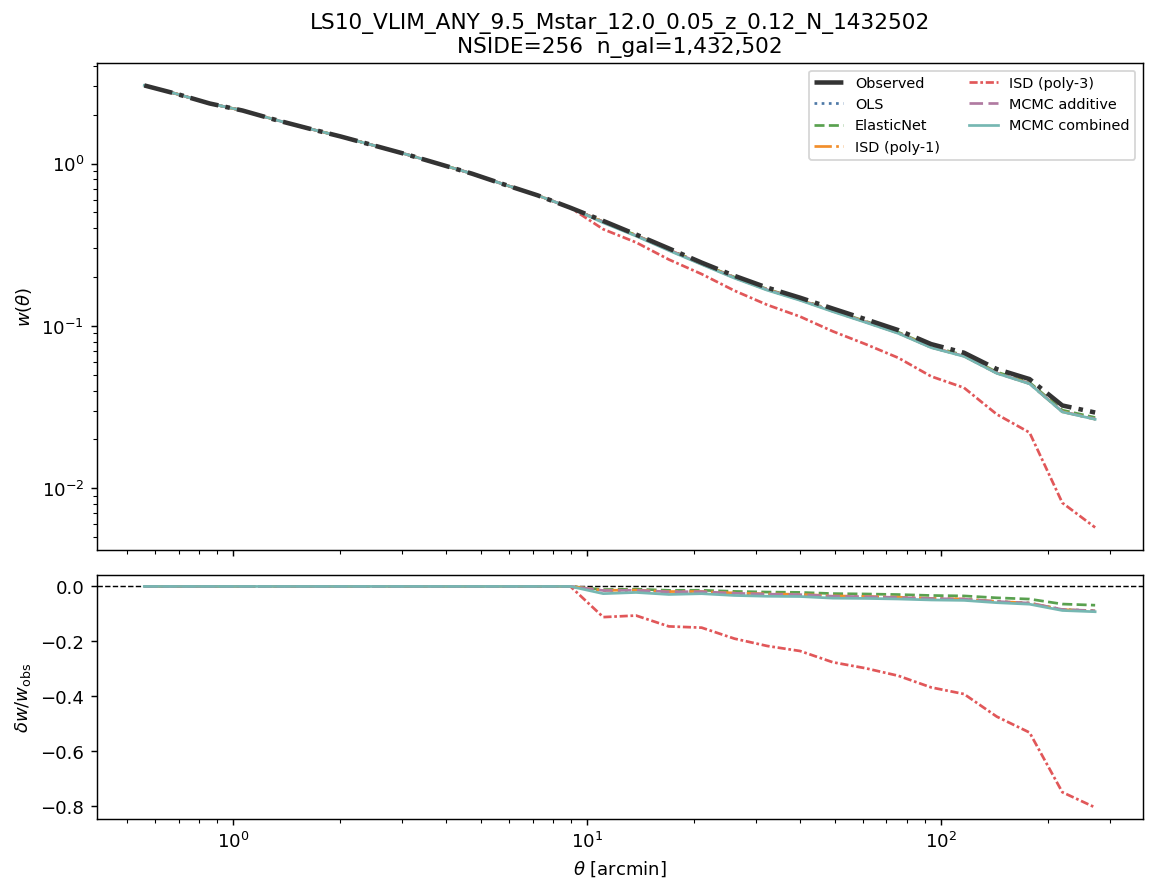
Angular clustering w(θ) before and after correction
Each panel shows the observed angular two-point correlation function (solid black) and the corrected \(w(\theta)\) for all six methods. A well-corrected sample shows suppressed excess clustering at all scales. Each panel corresponds to one map resolution.
w(θ): observed vs corrected — all six methods
Cosmological analysis verdict
Sub-degree scales (\(\theta < 30'\)): regime is strongly systematics-dominated (\(\delta w/w \approx -4.8\%\) at 30 arcmin).
Without correction: not suitable without correction.
After correction: suitable after applying
WEIGHT_COMB.
LRT (NSIDE 64): \(\lambda_{\rm LR} = 730.6\) (dof = 11), p = 1.5e-149 → Reject H₀ — multiplicative contamination is statistically detected.
Recommendation: use WEIGHT_COMB (WEIGHT_SYS) for all science-grade analyses.