BGS VLIM log M* ≥ 11.5, z < 0.35 — detailed systematic analysis
High-mass BGS VLIM sample (120,882 galaxies, z < 0.35). Shot noise dominates per-pixel statistics at both resolutions. The LRT rejects the additive null at NSIDE 64 (\(\lambda_{\rm LR} = 151.5\)).
See also
Results: systematic weights — summary tables and figures for all nine samples.
Sample statistics
Parameter |
NSIDE 32 |
NSIDE 64 |
NSIDE 128 |
NSIDE 256 |
|---|---|---|---|---|
Stellar-mass threshold |
log M* ≥ 11.5 |
log M* ≥ 11.5 |
log M* ≥ 11.5 |
log M* ≥ 11.5 |
Redshift limit |
z < 0.35 |
z < 0.35 |
z < 0.35 |
z < 0.35 |
Ngal |
120,882 |
120,882 |
120,882 |
120,882 |
Npix (good footprint) |
5,571 |
21,344 |
83,244 |
180,102 |
Ntemplates |
11 |
11 |
11 |
11 |
MCMC walkers |
210 |
210 |
210 |
210 |
MCMC steps after burn-in |
1500 |
1500 |
1500 |
1500 |
Goodness-of-fit: \(\hat{\sigma}\) by method and resolution
The noise parameter \(\hat{\sigma}\) measures residual scatter after systematic subtraction — lower is better. Results are shown for NSIDE 32, 64, 128, and 256. ISD-3 is unavailable at NSIDE 128 and 256 (no partial files generated at those resolutions).
Method |
\(\hat{\sigma}\) (N32) |
\(\hat{\sigma}\) (N64) |
\(\hat{\sigma}\) (N128) |
\(\hat{\sigma}\) (N256) |
Notes |
|---|---|---|---|---|---|
OLS |
0.4451 |
0.6438 |
1.3802 |
2.1098 |
closed-form least-squares |
ElasticNet |
0.4453 |
0.6440 |
1.3803 |
2.1098 |
L1+L2 regularised; 3-fold CV |
ISD-1 |
0.4451 |
0.6438 |
1.3802 |
2.1098 |
iterative self-calibration; poly order 1 |
ISD-3 † |
2.1206 |
1.0507 |
1.4249 |
2.1189 |
† degree-3 polynomial; unavailable at NSIDE 128/256 |
MCMC-add |
0.4455 |
0.6441 |
1.3803 |
2.1098 |
MCMC additive; acc N32=0.387 N64=0.388 |
MCMC-comb |
0.5862 |
0.7104 |
1.4304 |
2.0211 |
MCMC combined; acc N32=0.281 N64=0.287 |
† ISD-3 uses a degree-3 polynomial expansion and is ill-conditioned with correlated templates.
Likelihood Ratio Test (additive vs combined model)
Resolution |
\(\lambda_{\rm LR}\) |
dof |
p-value |
Reject H₀ |
|---|---|---|---|---|
NSIDE 32 |
352.1 |
11 |
< 10-69 |
Yes |
NSIDE 64 |
151.5 |
11 |
< 10-27 |
Yes |
NSIDE 128 |
196.7 |
11 |
< 10-36 |
Yes |
NSIDE 256 |
575.1 |
11 |
< 10-116 |
Yes |
MCMC acceptance fractions: NSIDE 32: add 0.387, comb 0.281 NSIDE 64: add 0.388, comb 0.287 NSIDE 128: add 0.388, comb 0.297 NSIDE 256: add 0.387, comb 0.283. Healthy range: 0.15–0.50.
Template amplitude ranking — additive model (MCMC-add, NSIDE 64)
All 11 templates sorted by absolute MCMC-add additive amplitude \(|\hat{a}_i|\). OLS shown for comparison.
Rank |
Template |
NSIDE |
\(\hat{a}_i\) (MCMC-add) |
\(\hat{a}_i\) (OLS) |
Physical meaning |
|---|---|---|---|---|---|
1 |
GAIA_nstar_medium |
64 |
-0.1024 |
-0.1062 |
GAIA medium stellar density (crowding and deblending near bright stars) |
2 |
GAIA_nstar_faint |
64 |
+0.0901 |
+0.0952 |
GAIA faint stellar density (photometric mis-classification of faint stars as galaxies) |
3 |
GAIA_phot_rp_mean_flux |
64 |
-0.0527 |
-0.0531 |
GAIA mean stellar flux in RP band (red scattered light) |
4 |
GAIA_phot_g_mean_flux |
64 |
+0.0501 |
+0.0507 |
GAIA mean stellar flux in G band (scattered-light / sky-background variations) |
5 |
GAIA_phot_bp_mean_flux |
64 |
-0.0288 |
-0.0292 |
GAIA mean stellar flux in BP band (blue scattered light) |
6 |
LS10_GALDEPTH_G_NSIDE_0064 |
? |
+0.0193 |
+0.0192 |
LS10_GALDEPTH_G_NSIDE_0064 |
7 |
LS10_PSFSIZE_R_NSIDE_0064 |
? |
-0.0098 |
-0.0098 |
LS10_PSFSIZE_R_NSIDE_0064 |
8 |
LS10_GALDEPTH_Z_NSIDE_0064 |
? |
+0.0083 |
+0.0084 |
LS10_GALDEPTH_Z_NSIDE_0064 |
9 |
LS10_NOBS_R_NSIDE_0064 |
? |
+0.0073 |
+0.0074 |
LS10_NOBS_R_NSIDE_0064 |
10 |
LS10_GALDEPTH_R_NSIDE_0064 |
? |
+0.0065 |
+0.0065 |
LS10_GALDEPTH_R_NSIDE_0064 |
11 |
LS10_EBV_NSIDE_0064 |
? |
+0.0031 |
+0.0032 |
LS10_EBV_NSIDE_0064 |
Template amplitude ranking — multiplicative model (MCMC-comb, NSIDE 64)
All 11 templates sorted by absolute MCMC-comb multiplicative amplitude \(|\hat{b}_i|\).
Rank |
Template |
NSIDE |
\(\hat{b}_i\) (MCMC-comb) |
Physical meaning |
|---|---|---|---|---|
1 |
GAIA_nstar_faint |
64 |
+0.6752 |
GAIA faint stellar density (photometric mis-classification of faint stars as galaxies) |
2 |
GAIA_nstar_medium |
64 |
-0.3323 |
GAIA medium stellar density (crowding and deblending near bright stars) |
3 |
LS10_EBV_NSIDE_0064 |
? |
+0.0415 |
LS10_EBV_NSIDE_0064 |
4 |
GAIA_phot_bp_mean_flux |
64 |
-0.0356 |
GAIA mean stellar flux in BP band (blue scattered light) |
5 |
GAIA_phot_g_mean_flux |
64 |
+0.0188 |
GAIA mean stellar flux in G band (scattered-light / sky-background variations) |
6 |
GAIA_phot_rp_mean_flux |
64 |
+0.0143 |
GAIA mean stellar flux in RP band (red scattered light) |
7 |
LS10_GALDEPTH_R_NSIDE_0064 |
? |
+0.0134 |
LS10_GALDEPTH_R_NSIDE_0064 |
8 |
LS10_NOBS_R_NSIDE_0064 |
? |
+0.0119 |
LS10_NOBS_R_NSIDE_0064 |
9 |
LS10_GALDEPTH_G_NSIDE_0064 |
? |
+0.0077 |
LS10_GALDEPTH_G_NSIDE_0064 |
10 |
LS10_GALDEPTH_Z_NSIDE_0064 |
? |
+0.0047 |
LS10_GALDEPTH_Z_NSIDE_0064 |
11 |
LS10_PSFSIZE_R_NSIDE_0064 |
? |
-0.0027 |
LS10_PSFSIZE_R_NSIDE_0064 |
Per-galaxy weight statistics (NSIDE 64)
From the *_NSIDE0064_WEIGHTS.fits file. Mean ≈ 1 and small std indicate a well-behaved weight distribution.
Method |
N |
mean |
std |
p1 |
p5 |
p50 |
p95 |
p99 |
|---|---|---|---|---|---|---|---|---|
OLS |
120,882 |
0.9677 |
0.0399 |
0.8457 |
0.9089 |
0.9695 |
1.0270 |
1.0636 |
ElasticNet |
120,882 |
0.9717 |
0.0339 |
0.8605 |
0.9216 |
0.9759 |
1.0171 |
1.0473 |
ISD-1 |
120,882 |
0.9678 |
0.0397 |
0.8441 |
0.9085 |
0.9697 |
1.0266 |
1.0620 |
ISD-3 † |
120,882 |
3.3404 |
14.7097 |
0.2588 |
0.5345 |
0.9954 |
2.0296 |
100.0000 |
MCMC-add |
120,882 |
0.9677 |
0.0397 |
0.8457 |
0.9091 |
0.9696 |
1.0265 |
1.0630 |
MCMC-comb |
120,882 |
1.1084 |
0.0572 |
0.9525 |
1.0000 |
1.1186 |
1.1849 |
1.2112 |
Systematic weight maps
Mollweide weight maps — all six methods
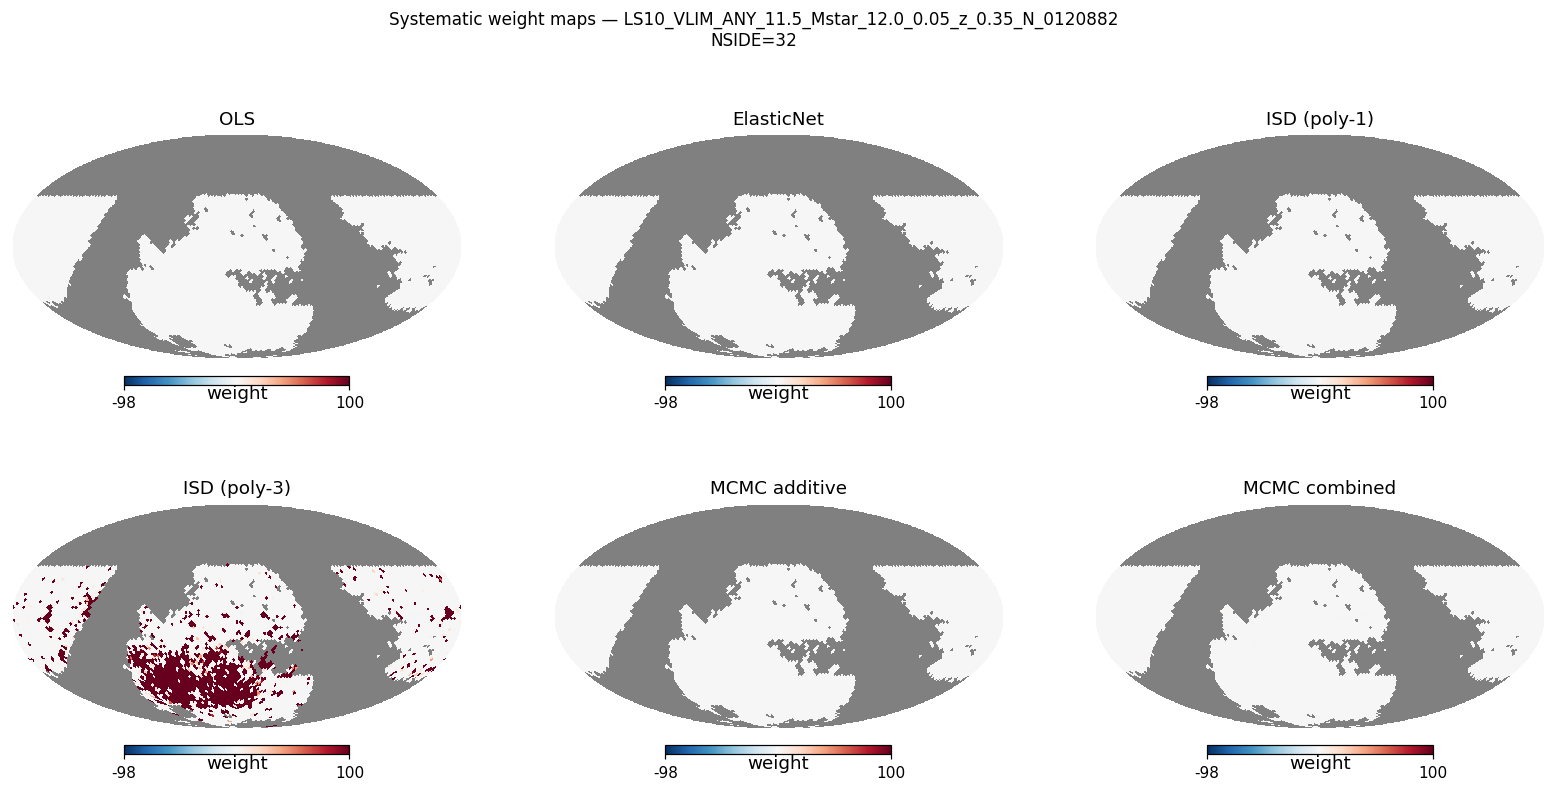
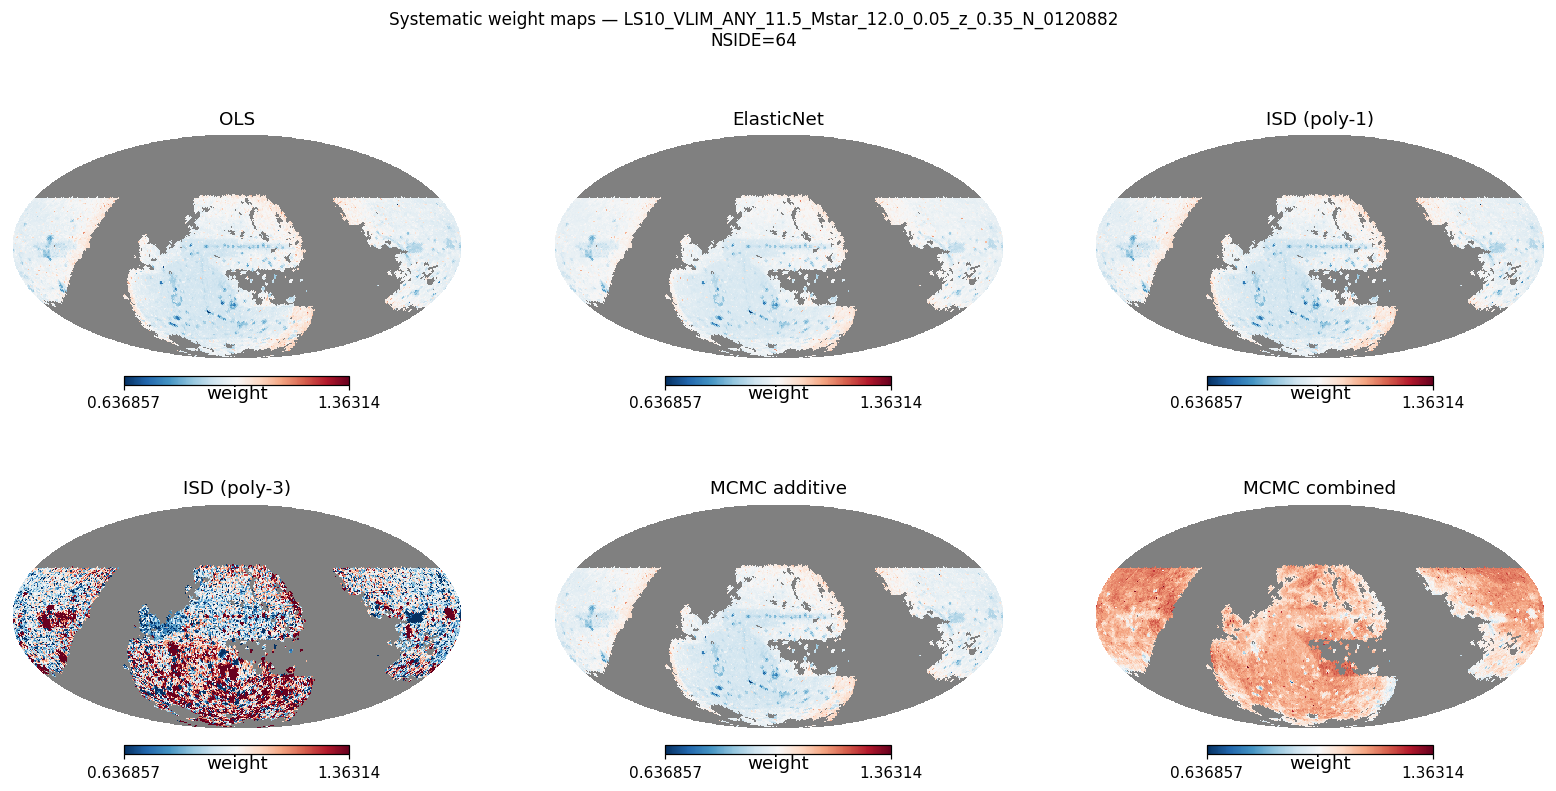
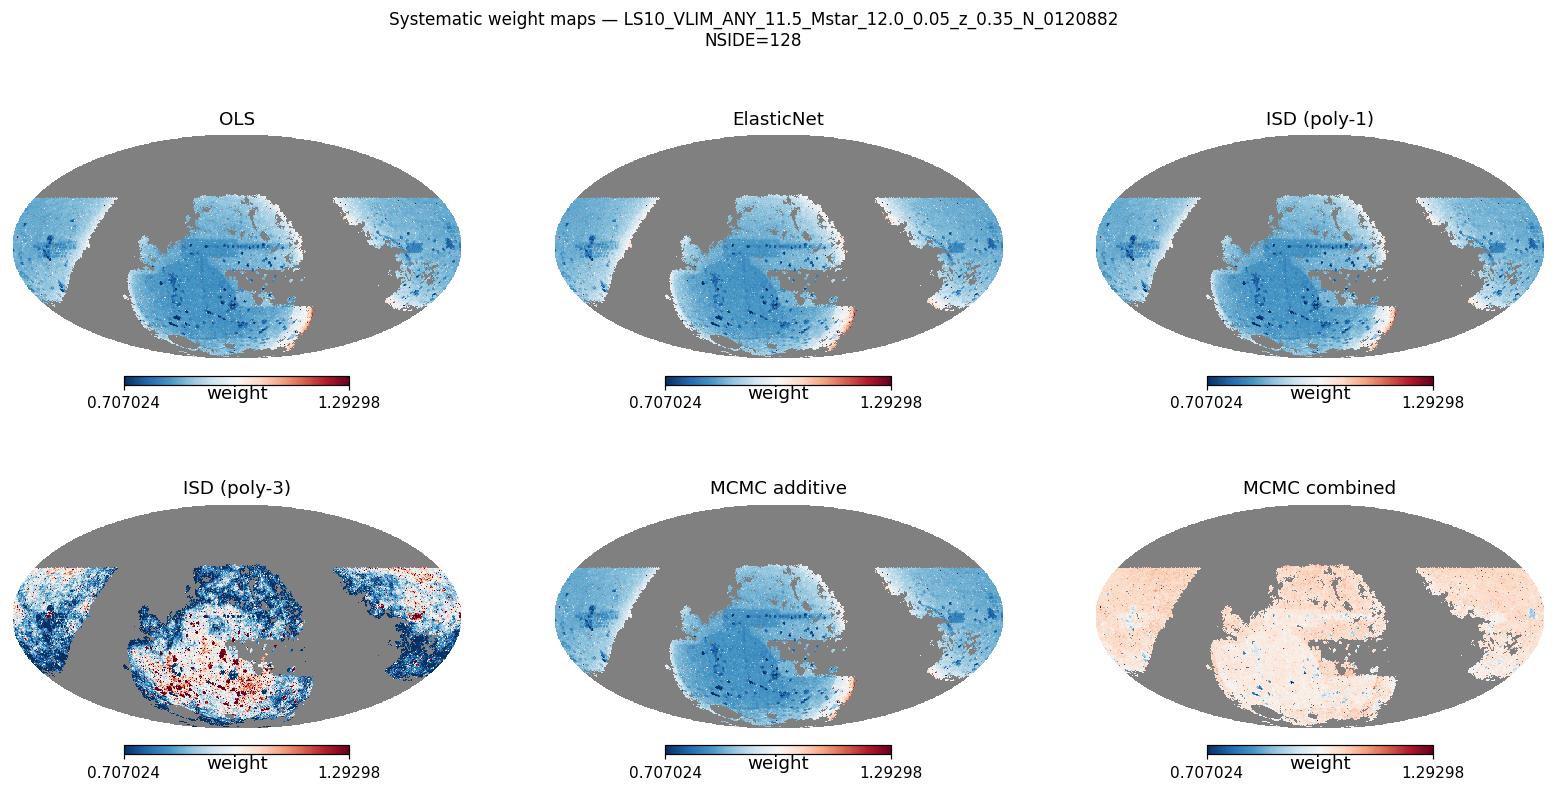
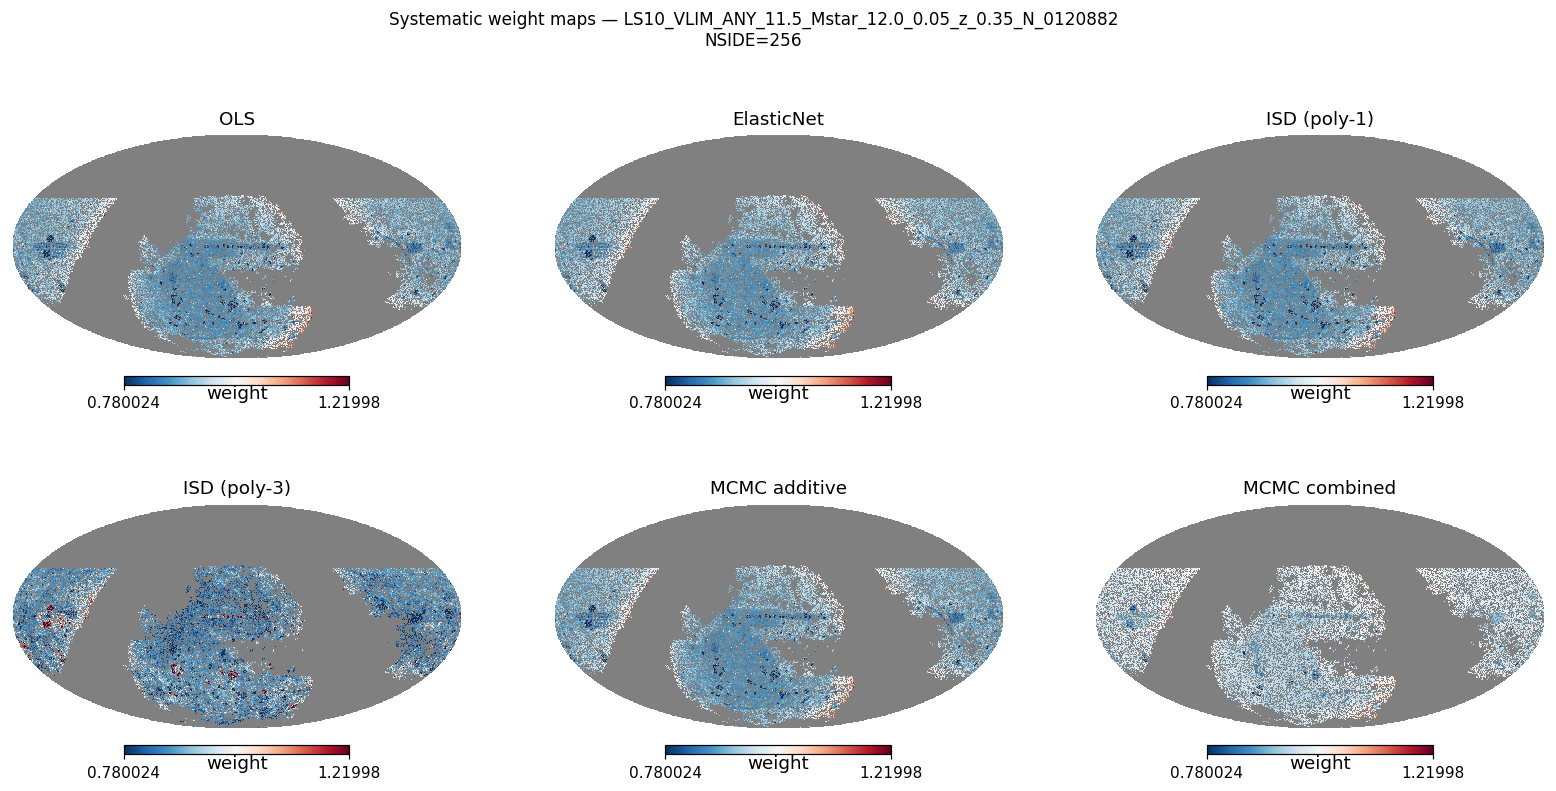
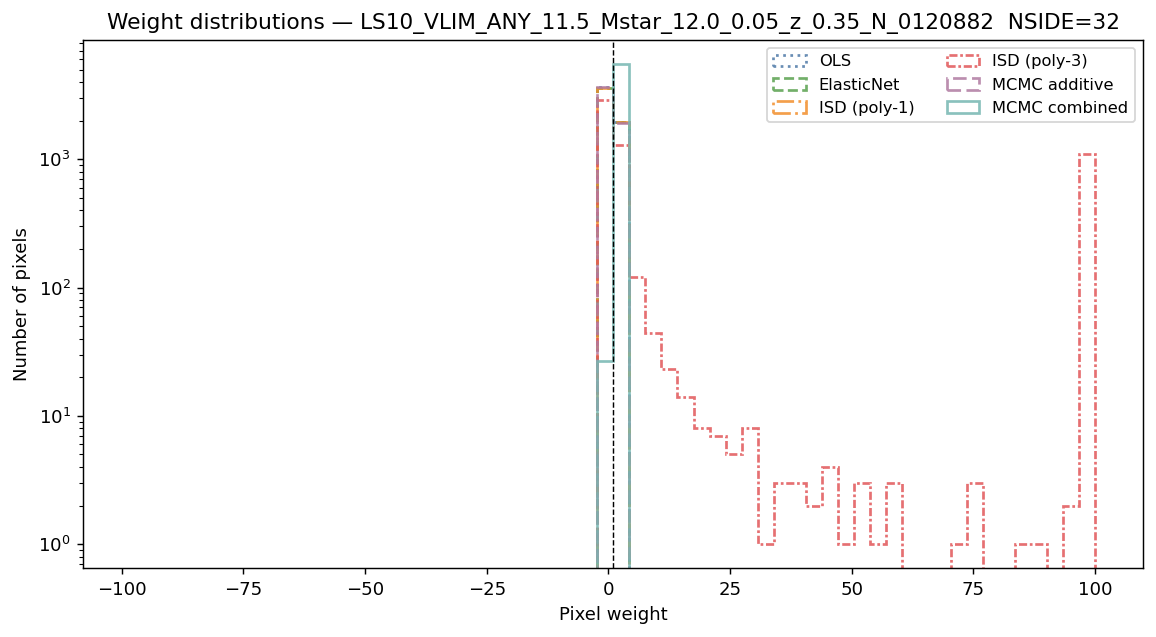
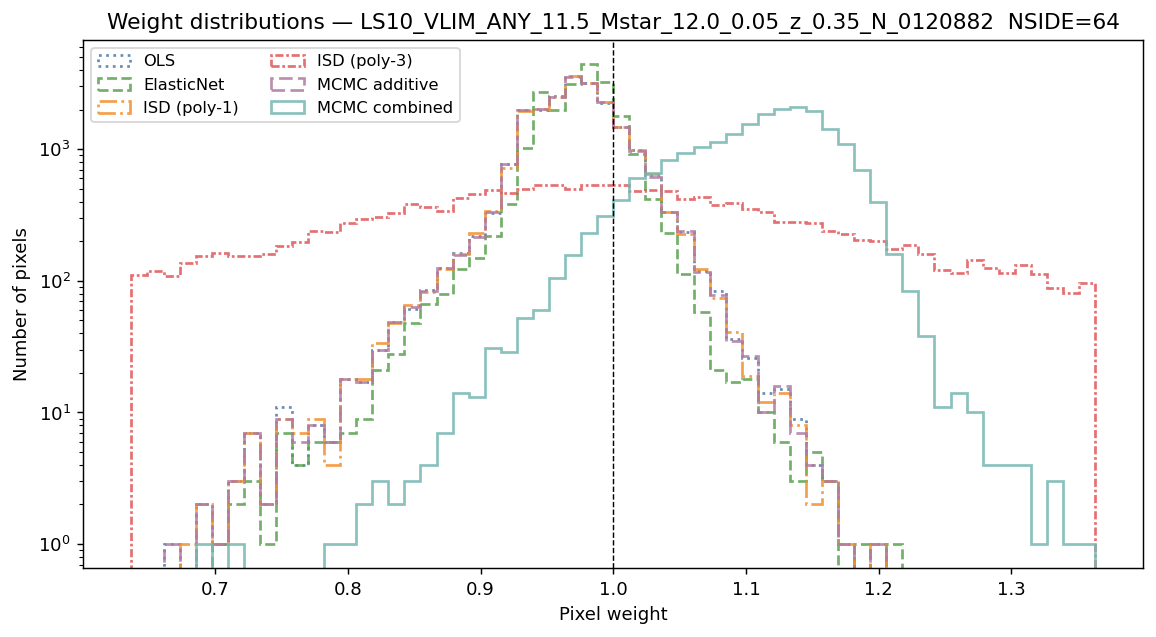
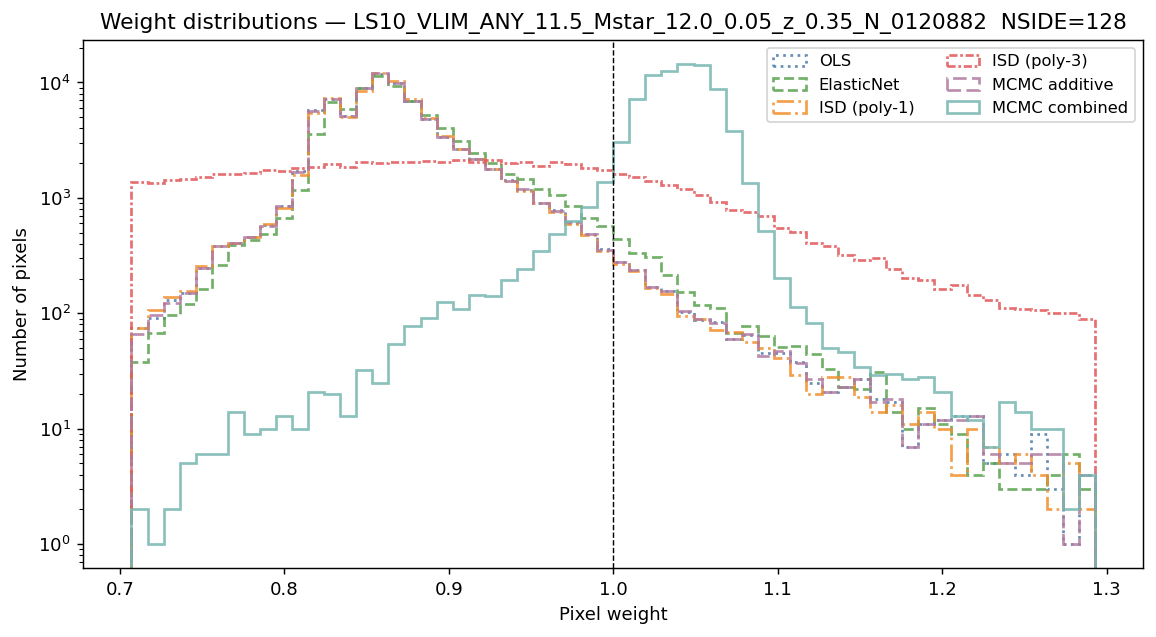
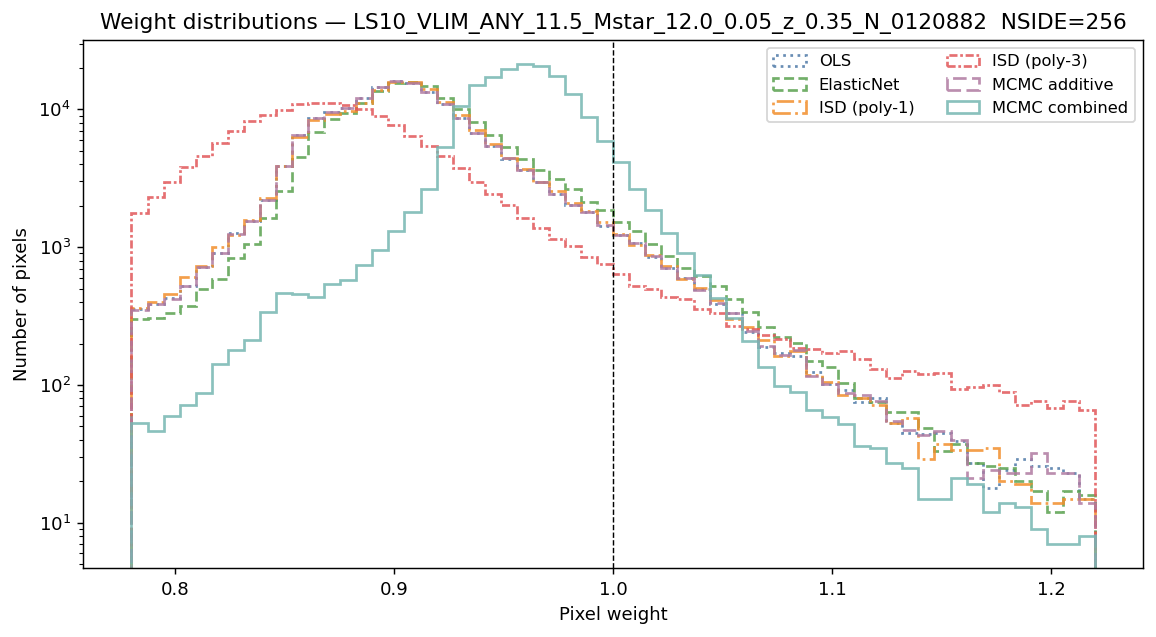
Systematic weight distributions
Narrow peaks near 1 indicate stable weight estimates. ElasticNet weights may be exactly 1 when cross-validation selects zero amplitudes.
Per-galaxy weight distributions — all six methods
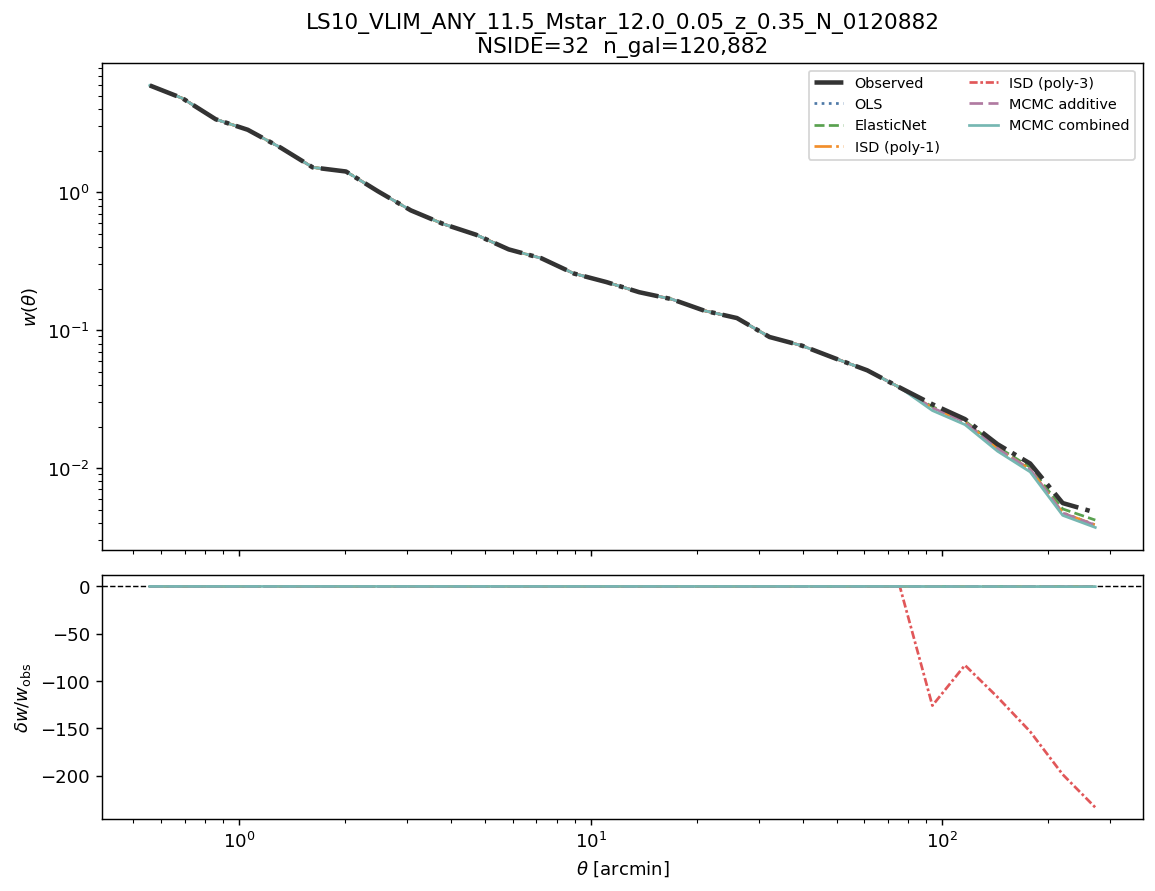
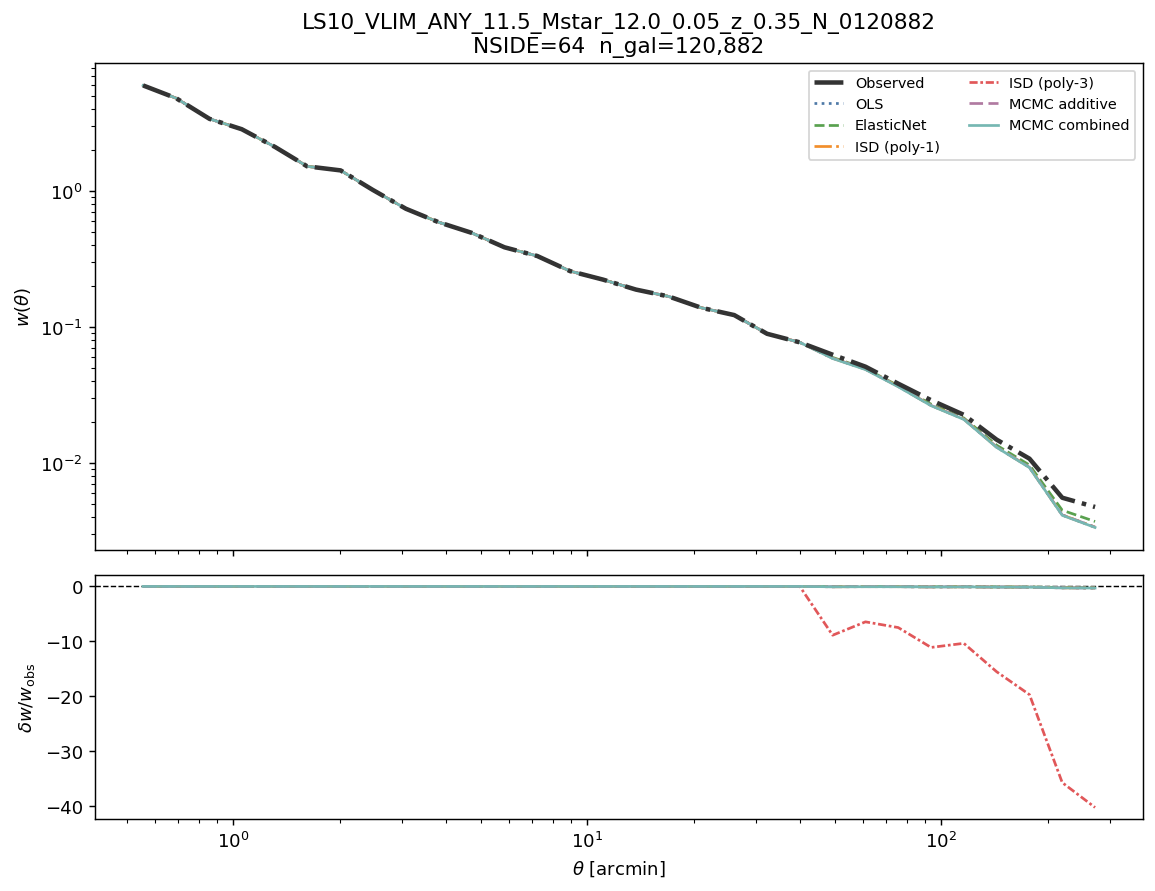
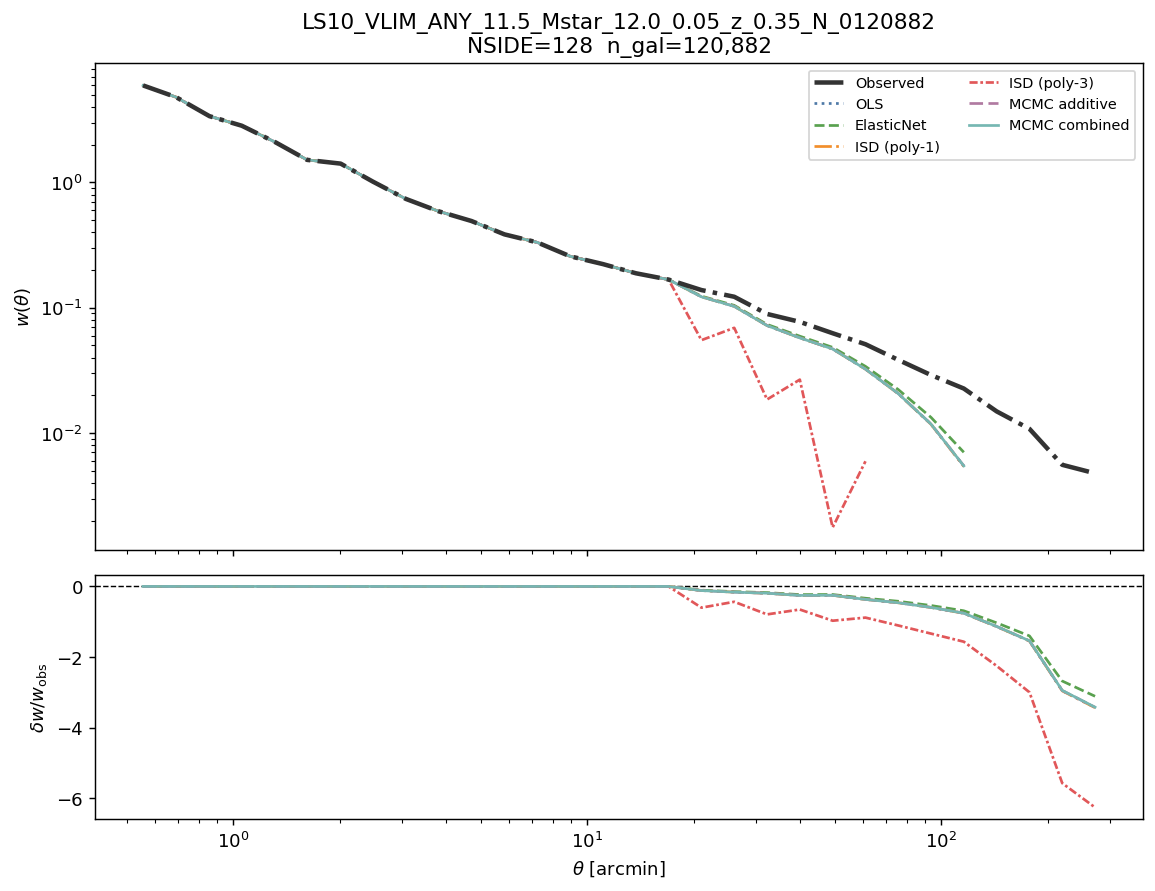
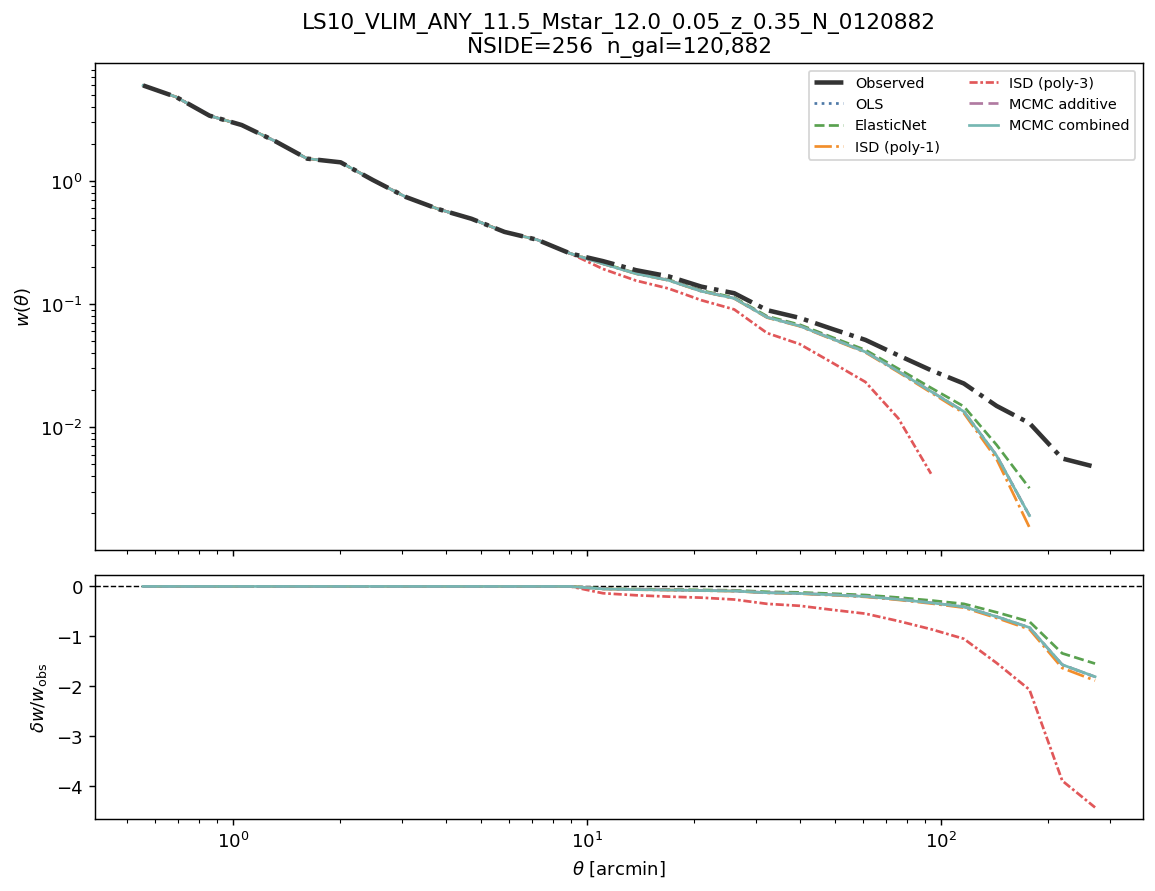
Angular clustering w(θ) before and after correction
Each panel shows the observed angular two-point correlation function (solid black) and the corrected \(w(\theta)\) for all six methods. A well-corrected sample shows suppressed excess clustering at all scales. Each panel corresponds to one map resolution.
w(θ): observed vs corrected — all six methods
Cosmological analysis verdict
Sub-degree scales (\(\theta < 30'\)): regime is sub-percent contamination (below noise floor) (\(\delta w/w \approx +0.7\%\) at 30 arcmin).
Without correction: suitable even without correction.
After correction: suitable — correction provides marginal improvement.
Large-angle warning (\(\theta > 2°\)): max correction 9.7% at 97 arcmin — any analysis using angular scales > 1° must apply
WEIGHT_COMB.
LRT (NSIDE 64): \(\lambda_{\rm LR} = 151.5\) (dof = 11), p = 7.3e-27 → Reject H₀ — multiplicative contamination is statistically detected.
Recommendation: use WEIGHT_COMB (WEIGHT_SYS) for all science-grade analyses.