BGS VLIM log M* ≥ 11.25, z < 0.35 — detailed systematic analysis
High-mass BGS VLIM sample (541,855 galaxies, z < 0.35). Shot noise dominates per-pixel statistics at both resolutions. The LRT rejects the additive null at NSIDE 64 (\(\lambda_{\rm LR} = 123.4\)).
See also
Results: systematic weights — summary tables and figures for all nine samples.
Sample statistics
Parameter |
NSIDE 32 |
NSIDE 64 |
NSIDE 128 |
NSIDE 256 |
|---|---|---|---|---|
Stellar-mass threshold |
log M* ≥ 11.25 |
log M* ≥ 11.25 |
log M* ≥ 11.25 |
log M* ≥ 11.25 |
Redshift limit |
z < 0.35 |
z < 0.35 |
z < 0.35 |
z < 0.35 |
Ngal |
541,855 |
541,855 |
541,855 |
541,855 |
Npix (good footprint) |
5,609 |
21,555 |
84,131 |
325,324 |
Ntemplates |
11 |
11 |
11 |
11 |
MCMC walkers |
210 |
210 |
210 |
210 |
MCMC steps after burn-in |
1500 |
1500 |
1500 |
1500 |
Goodness-of-fit: \(\hat{\sigma}\) by method and resolution
The noise parameter \(\hat{\sigma}\) measures residual scatter after systematic subtraction — lower is better. Results are shown for NSIDE 32, 64, 128, and 256. ISD-3 is unavailable at NSIDE 128 and 256 (no partial files generated at those resolutions).
Method |
\(\hat{\sigma}\) (N32) |
\(\hat{\sigma}\) (N64) |
\(\hat{\sigma}\) (N128) |
\(\hat{\sigma}\) (N256) |
Notes |
|---|---|---|---|---|---|
OLS |
0.3308 |
0.3842 |
0.6405 |
1.2602 |
closed-form least-squares |
ElasticNet |
0.3319 |
0.3846 |
0.6406 |
1.2603 |
L1+L2 regularised; 3-fold CV |
ISD-1 |
0.3308 |
0.3842 |
0.6405 |
1.2602 |
iterative self-calibration; poly order 1 |
ISD-3 † |
0.7031 |
0.6196 |
0.6454 |
1.3131 |
† degree-3 polynomial; unavailable at NSIDE 128/256 |
MCMC-add |
0.3313 |
0.3843 |
0.6406 |
1.2602 |
MCMC additive; acc N32=0.386 N64=0.389 |
MCMC-comb |
0.4062 |
0.3930 |
0.6329 |
1.2117 |
MCMC combined; acc N32=0.293 N64=0.288 |
† ISD-3 uses a degree-3 polynomial expansion and is ill-conditioned with correlated templates.
Likelihood Ratio Test (additive vs combined model)
Resolution |
\(\lambda_{\rm LR}\) |
dof |
p-value |
Reject H₀ |
|---|---|---|---|---|
NSIDE 32 |
613.5 |
11 |
< 10-124 |
Yes |
NSIDE 64 |
123.4 |
11 |
< 10-21 |
Yes |
NSIDE 128 |
140.8 |
11 |
< 10-24 |
Yes |
NSIDE 256 |
597.3 |
11 |
< 10-121 |
Yes |
MCMC acceptance fractions: NSIDE 32: add 0.386, comb 0.293 NSIDE 64: add 0.389, comb 0.288 NSIDE 128: add 0.387, comb 0.287 NSIDE 256: add 0.390, comb 0.301. Healthy range: 0.15–0.50.
Template amplitude ranking — additive model (MCMC-add, NSIDE 64)
All 11 templates sorted by absolute MCMC-add additive amplitude \(|\hat{a}_i|\). OLS shown for comparison.
Rank |
Template |
NSIDE |
\(\hat{a}_i\) (MCMC-add) |
\(\hat{a}_i\) (OLS) |
Physical meaning |
|---|---|---|---|---|---|
1 |
GAIA_nstar_faint |
64 |
+0.2755 |
+0.2785 |
GAIA faint stellar density (photometric mis-classification of faint stars as galaxies) |
2 |
GAIA_nstar_medium |
64 |
-0.1944 |
-0.1970 |
GAIA medium stellar density (crowding and deblending near bright stars) |
3 |
GAIA_phot_g_mean_flux |
64 |
+0.0530 |
+0.0522 |
GAIA mean stellar flux in G band (scattered-light / sky-background variations) |
4 |
GAIA_phot_rp_mean_flux |
64 |
-0.0511 |
-0.0504 |
GAIA mean stellar flux in RP band (red scattered light) |
5 |
GAIA_phot_bp_mean_flux |
64 |
-0.0334 |
-0.0331 |
GAIA mean stellar flux in BP band (blue scattered light) |
6 |
LS10_GALDEPTH_G_NSIDE_0064 |
? |
+0.0132 |
+0.0131 |
LS10_GALDEPTH_G_NSIDE_0064 |
7 |
LS10_PSFSIZE_R_NSIDE_0064 |
? |
-0.0079 |
-0.0079 |
LS10_PSFSIZE_R_NSIDE_0064 |
8 |
LS10_GALDEPTH_Z_NSIDE_0064 |
? |
+0.0054 |
+0.0054 |
LS10_GALDEPTH_Z_NSIDE_0064 |
9 |
LS10_NOBS_R_NSIDE_0064 |
? |
+0.0044 |
+0.0045 |
LS10_NOBS_R_NSIDE_0064 |
10 |
LS10_GALDEPTH_R_NSIDE_0064 |
? |
+0.0034 |
+0.0034 |
LS10_GALDEPTH_R_NSIDE_0064 |
11 |
LS10_EBV_NSIDE_0064 |
? |
-0.0029 |
-0.0028 |
LS10_EBV_NSIDE_0064 |
Template amplitude ranking — multiplicative model (MCMC-comb, NSIDE 64)
All 11 templates sorted by absolute MCMC-comb multiplicative amplitude \(|\hat{b}_i|\).
Rank |
Template |
NSIDE |
\(\hat{b}_i\) (MCMC-comb) |
Physical meaning |
|---|---|---|---|---|
1 |
GAIA_nstar_faint |
64 |
+0.3944 |
GAIA faint stellar density (photometric mis-classification of faint stars as galaxies) |
2 |
GAIA_nstar_medium |
64 |
-0.2422 |
GAIA medium stellar density (crowding and deblending near bright stars) |
3 |
LS10_EBV_NSIDE_0064 |
? |
+0.0513 |
LS10_EBV_NSIDE_0064 |
4 |
GAIA_phot_bp_mean_flux |
64 |
-0.0343 |
GAIA mean stellar flux in BP band (blue scattered light) |
5 |
GAIA_phot_g_mean_flux |
64 |
+0.0288 |
GAIA mean stellar flux in G band (scattered-light / sky-background variations) |
6 |
GAIA_phot_rp_mean_flux |
64 |
-0.0168 |
GAIA mean stellar flux in RP band (red scattered light) |
7 |
LS10_GALDEPTH_G_NSIDE_0064 |
? |
+0.0137 |
LS10_GALDEPTH_G_NSIDE_0064 |
8 |
LS10_GALDEPTH_R_NSIDE_0064 |
? |
+0.0098 |
LS10_GALDEPTH_R_NSIDE_0064 |
9 |
LS10_GALDEPTH_Z_NSIDE_0064 |
? |
-0.0063 |
LS10_GALDEPTH_Z_NSIDE_0064 |
10 |
LS10_NOBS_R_NSIDE_0064 |
? |
+0.0054 |
LS10_NOBS_R_NSIDE_0064 |
11 |
LS10_PSFSIZE_R_NSIDE_0064 |
? |
-0.0016 |
LS10_PSFSIZE_R_NSIDE_0064 |
Per-galaxy weight statistics (NSIDE 64)
From the *_NSIDE0064_WEIGHTS.fits file. Mean ≈ 1 and small std indicate a well-behaved weight distribution.
Method |
N |
mean |
std |
p1 |
p5 |
p50 |
p95 |
p99 |
|---|---|---|---|---|---|---|---|---|
OLS |
541,855 |
0.9914 |
0.0352 |
0.8993 |
0.9443 |
0.9892 |
1.0495 |
1.0841 |
ElasticNet |
541,855 |
0.9906 |
0.0252 |
0.9133 |
0.9564 |
0.9927 |
1.0248 |
1.0468 |
ISD-1 |
541,855 |
0.9914 |
0.0355 |
0.8980 |
0.9439 |
0.9893 |
1.0500 |
1.0844 |
ISD-3 † |
541,855 |
1.8450 |
9.0095 |
0.7238 |
0.8593 |
0.9633 |
1.2506 |
5.9101 |
MCMC-add |
541,855 |
0.9914 |
0.0352 |
0.8990 |
0.9445 |
0.9892 |
1.0493 |
1.0843 |
MCMC-comb |
541,855 |
1.0292 |
0.0470 |
0.9159 |
0.9462 |
1.0363 |
1.0932 |
1.1294 |
Systematic weight maps
Mollweide weight maps — all six methods
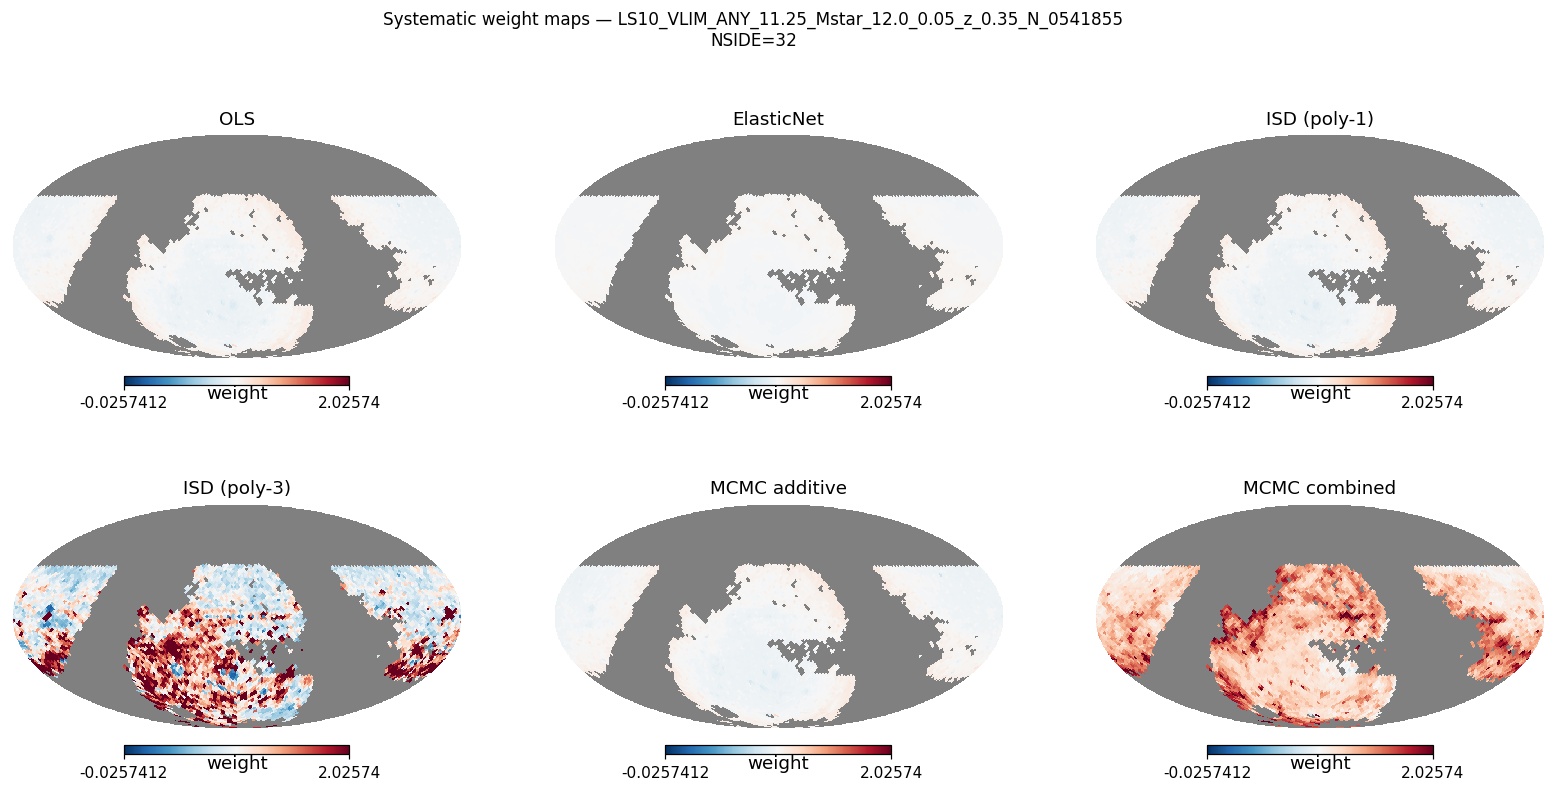
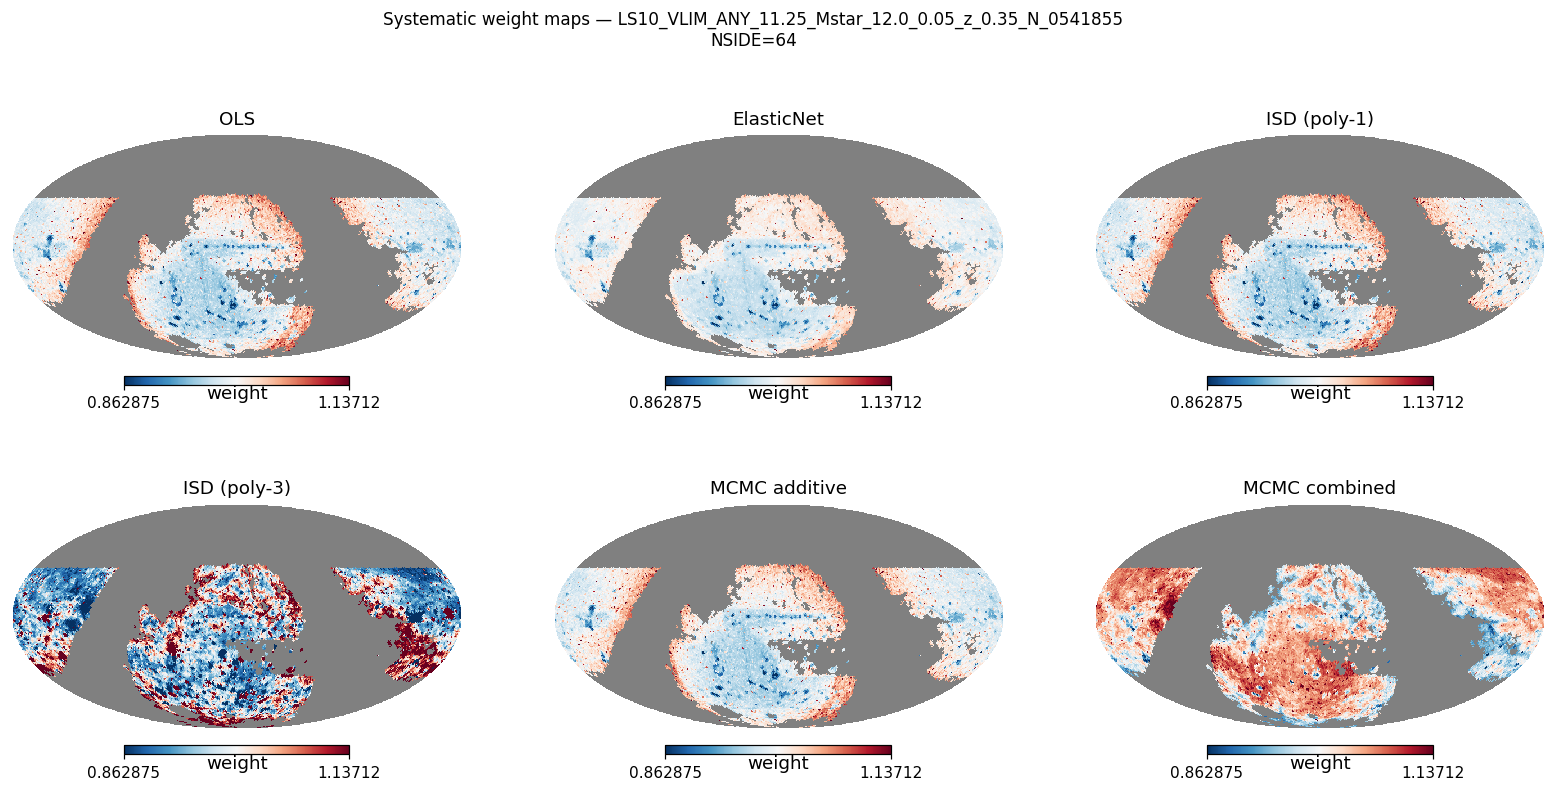
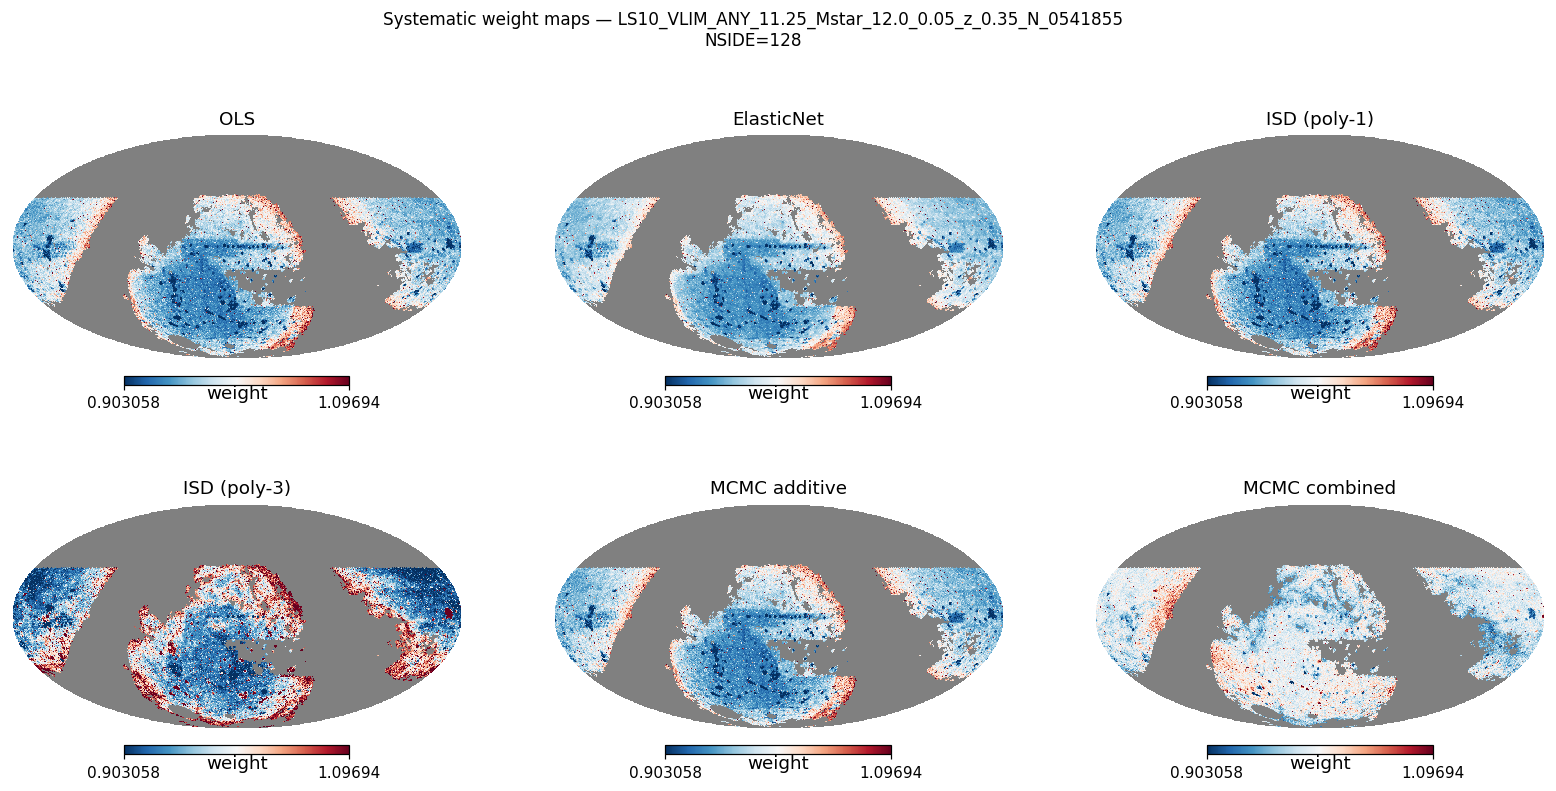
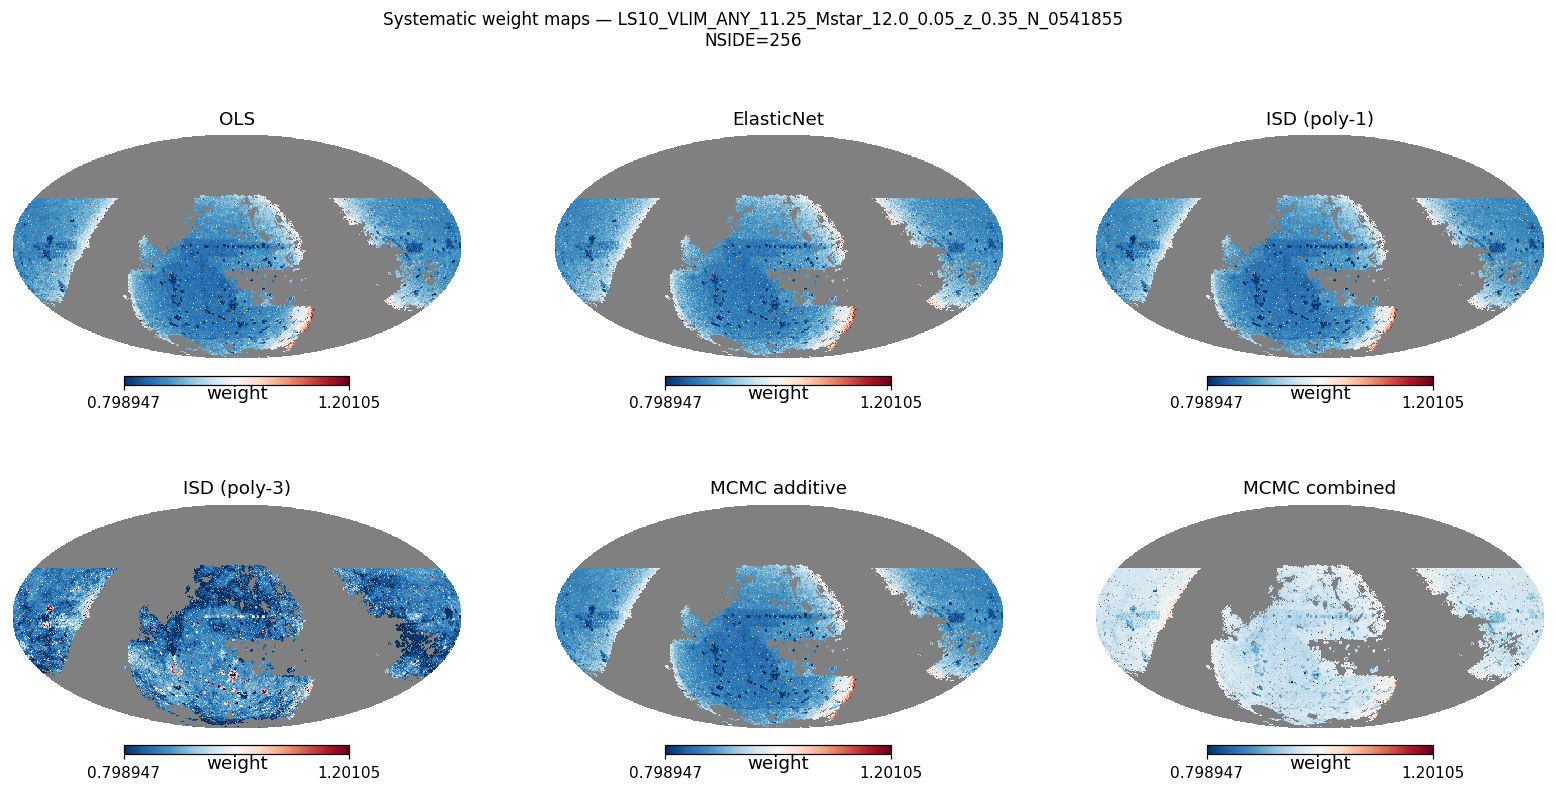
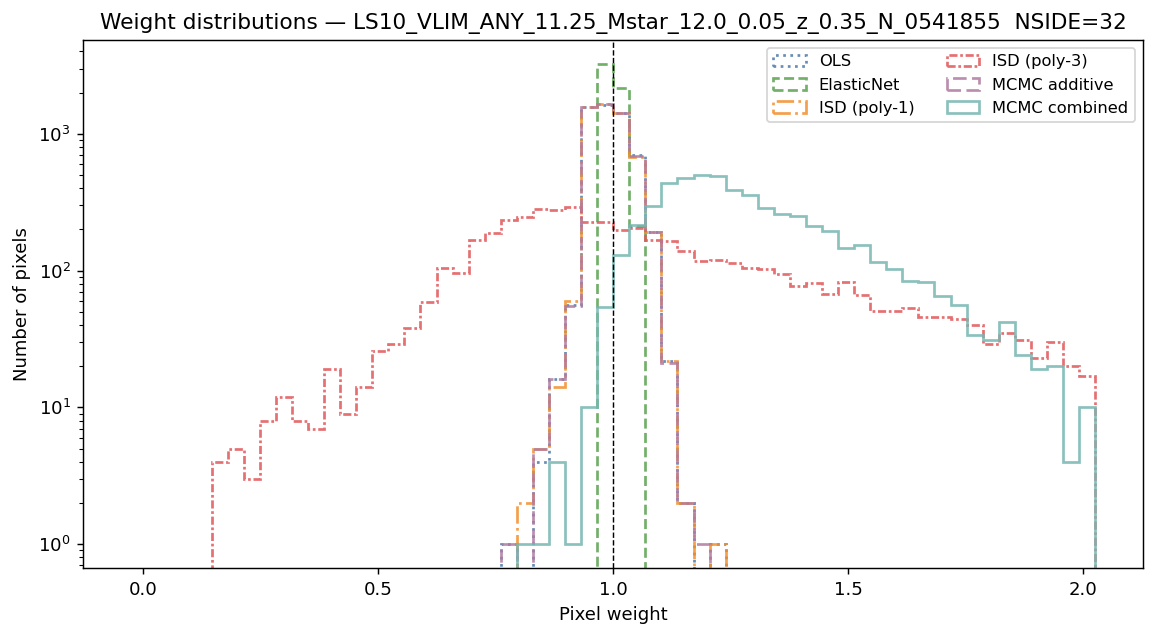
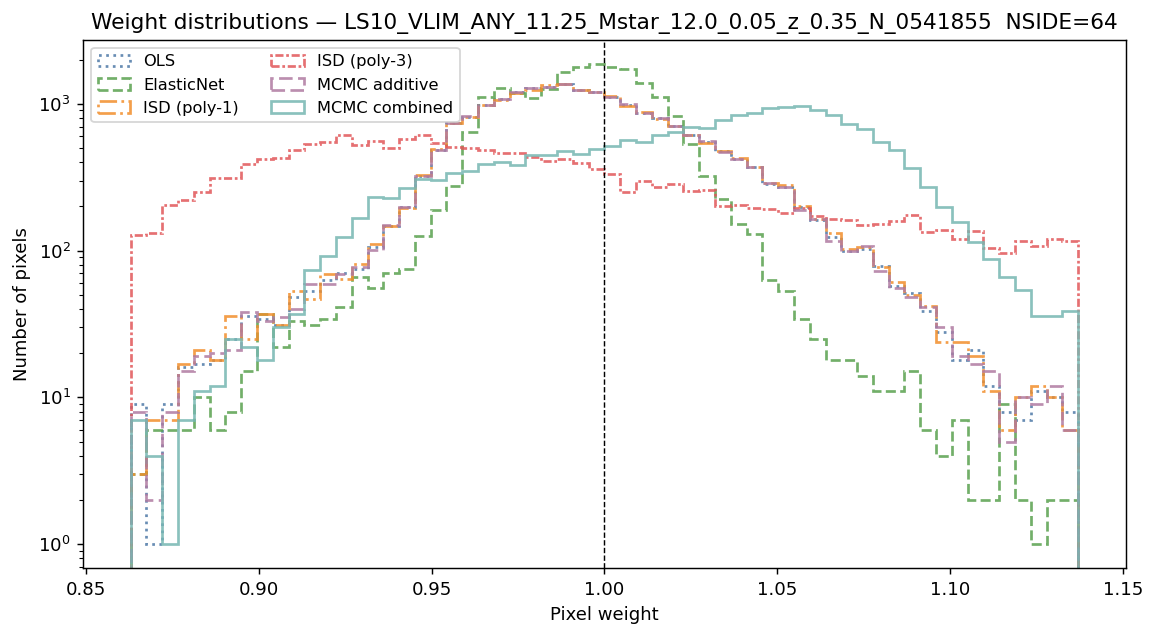
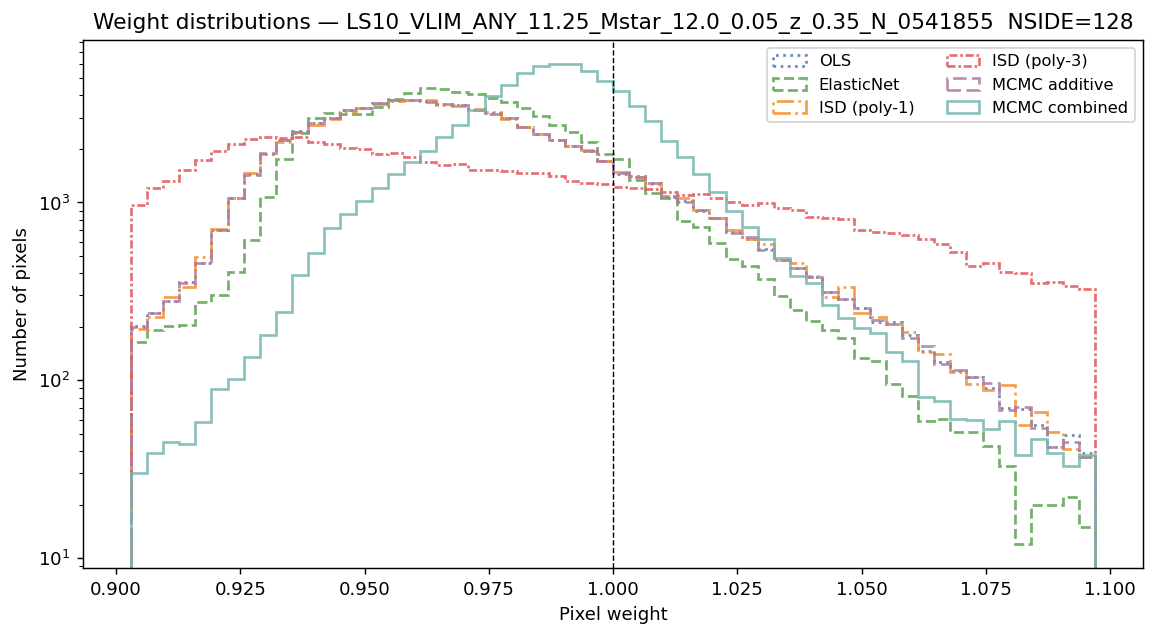
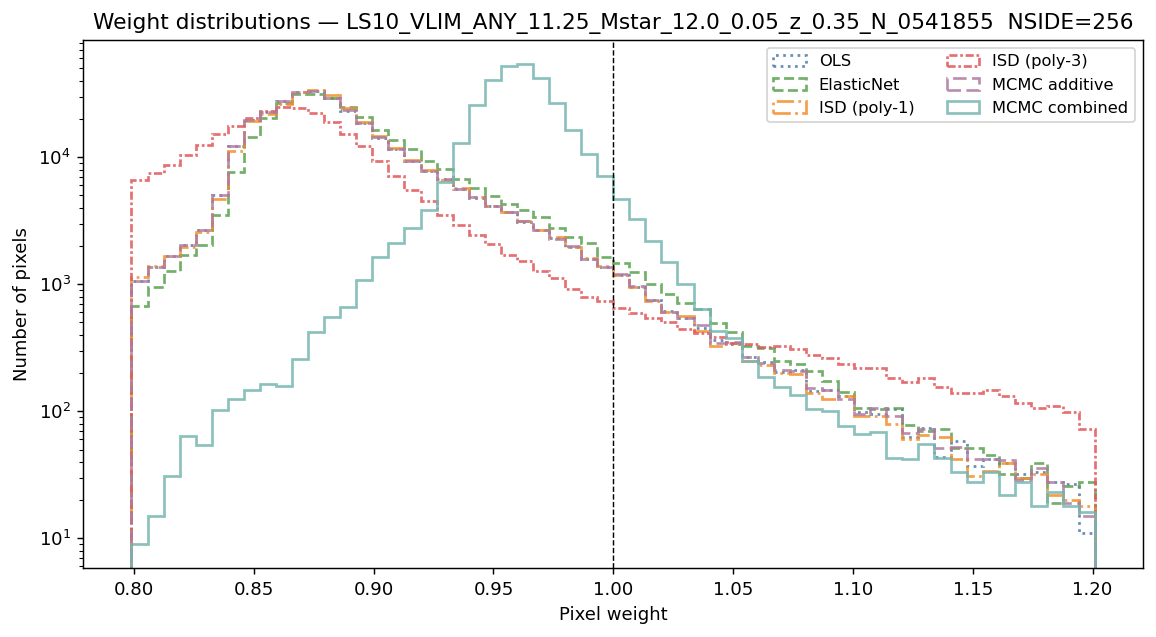
Systematic weight distributions
Narrow peaks near 1 indicate stable weight estimates. ElasticNet weights may be exactly 1 when cross-validation selects zero amplitudes.
Per-galaxy weight distributions — all six methods
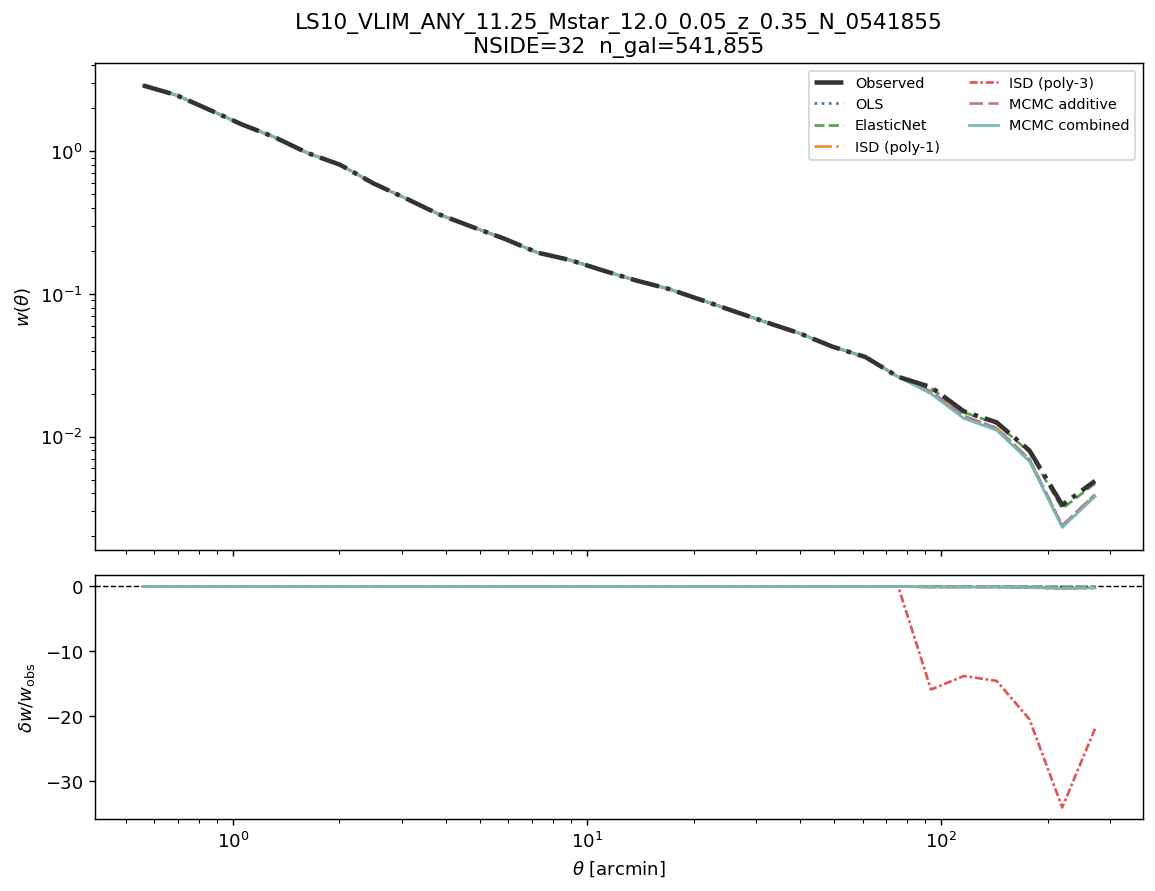
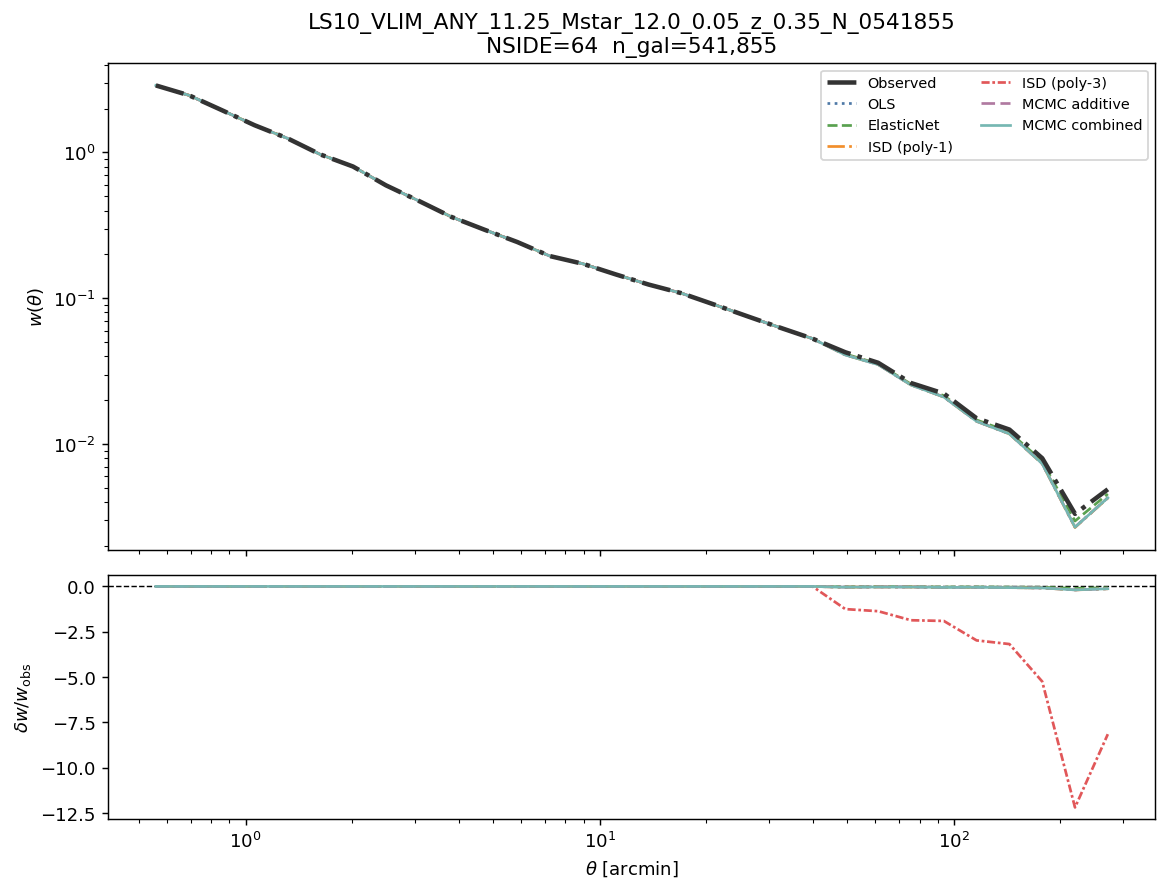
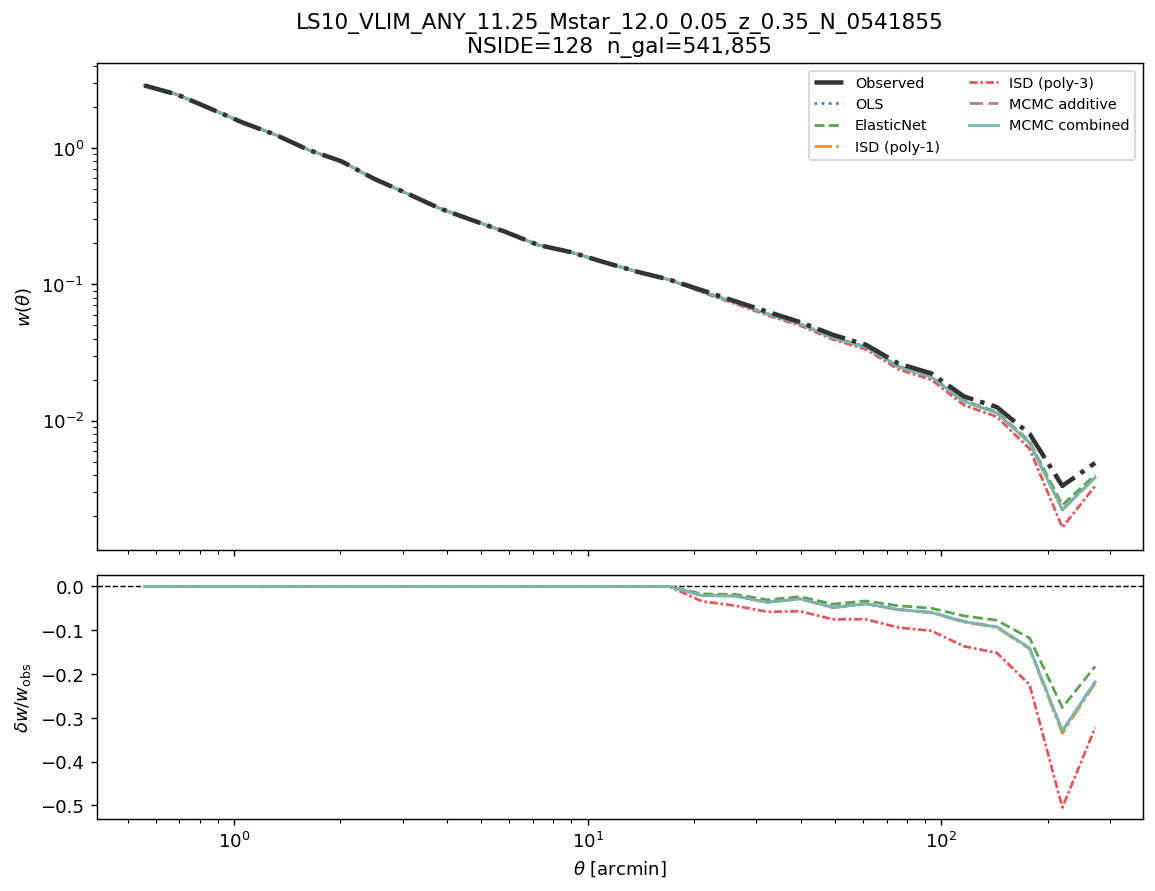
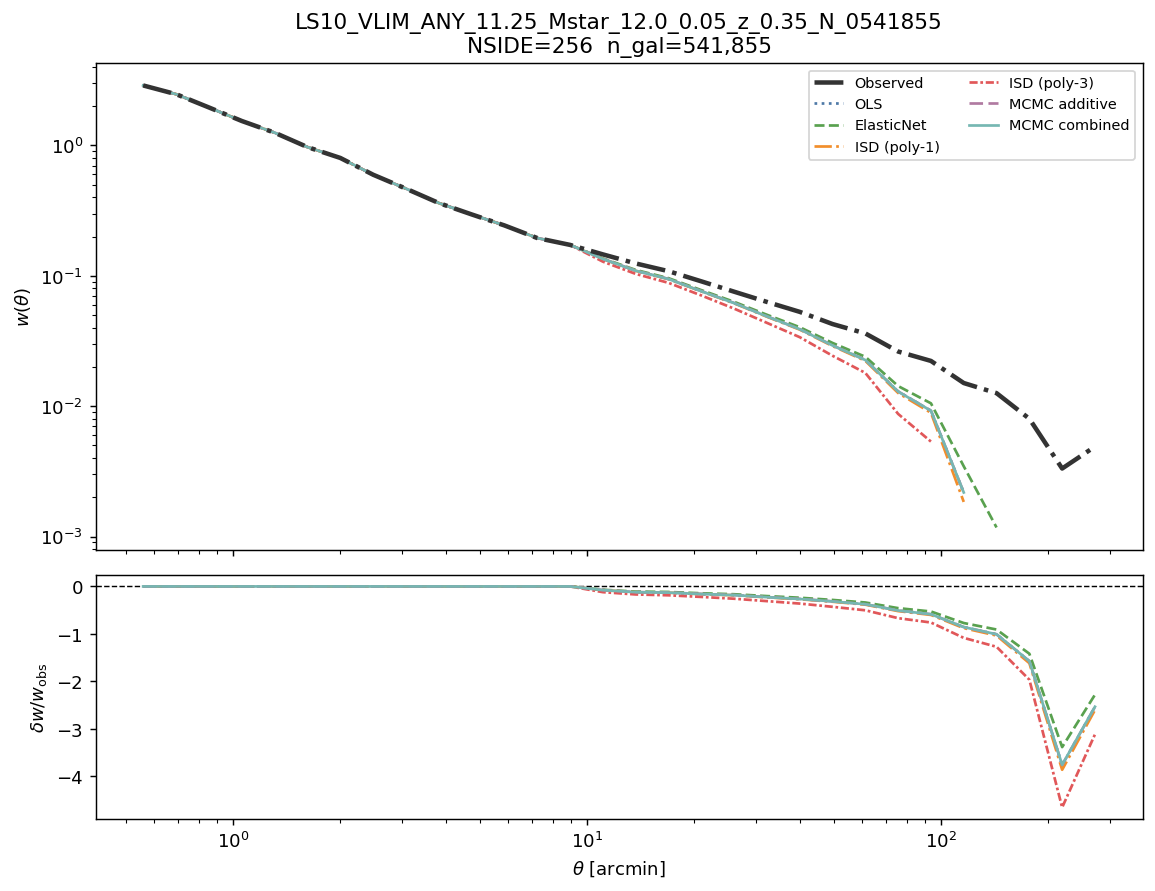
Angular clustering w(θ) before and after correction
Each panel shows the observed angular two-point correlation function (solid black) and the corrected \(w(\theta)\) for all six methods. A well-corrected sample shows suppressed excess clustering at all scales. Each panel corresponds to one map resolution.
w(θ): observed vs corrected — all six methods
Cosmological analysis verdict
Sub-degree scales (\(\theta < 30'\)): regime is moderately contaminated (\(\delta w/w \approx +2.2\%\) at 30 arcmin).
Without correction: borderline without correction.
After correction: suitable after applying
WEIGHT_COMB.Large-angle warning (\(\theta > 2°\)): max correction 17.4% at 181 arcmin — any analysis using angular scales > 1° must apply
WEIGHT_COMB.
LRT (NSIDE 64): \(\lambda_{\rm LR} = 123.4\) (dof = 11), p = 3.7e-21 → Reject H₀ — multiplicative contamination is statistically detected.
Recommendation: use WEIGHT_COMB (WEIGHT_SYS) for all science-grade analyses.