Results: SNR-based Template Pre-selection
Overview
When tens or hundreds of imaging-systematic maps are available, running the full Bayesian decontamination pipeline on all of them simultaneously is computationally expensive and numerically ill-conditioned. The SNR pre-selection pipeline addresses this by inserting a fast Stage 1 before the full Stage 2 decontamination:
Stage 1 — SNR ranking. All candidate templates are scored by their correlation with the observed galaxy overdensity. The top-\(K\) templates are retained.
Stage 2 — Full decontamination. The reduced template set is passed to the standard greedy forward selection or Bayesian MCMC pipeline.
This document validates Stage 1 against a controlled simulation where the injected templates are known a priori.
Three ranking statistics are implemented (see sys_mapping.diagnostics):
Method key |
Description |
|---|---|
|
Pearson cross-correlation \(|r|\) between the observed overdensity \(\delta_g\) and each template \(\delta_t\). |
|
OLS regression of \(\delta_g\) on each template individually; SNR = \(|\hat\alpha| / \sigma_{\hat\alpha}\) (absolute t-statistic). |
|
ISD \(\Delta\chi^2\) contamination metric (Rodríguez-Monroy et al. 2025, arXiv:2509.07943, Sec. IV.A.1). Pixels are binned by template value; a polynomial is fit to the binned galaxy density; \(\Delta\chi^2 = \chi^2_\mathrm{null} - \chi^2_\mathrm{model}\) measures how much the polynomial reduces the scatter. |
A fourth optional statistic, "peak", ranks templates by the peak amplitude
of the cross-power spectrum \(C_\ell^{gT}\).
For a rigorous significance test, sys_mapping.diagnostics.isd_template_significance()
compares \(\Delta\chi^2_\mathrm{data}\) against a distribution of
\(\Delta\chi^2_\mathrm{mock}\) values computed from GLASS systematic-free
mocks on the same footprint, producing mock-based p-values.
Simulation setup
Parameter |
Value |
|---|---|
HEALPix resolution |
NSIDE = 32 (\(n_\mathrm{pix}\) = 12 288) |
Galaxy count |
15 000 000 (full sky) |
Redshift shell |
\(0 \le z \le 0.5\) (single tophat bin) |
Systematic templates |
20 synthetic maps; families 0–4 generated 4× with independent seeds
(see |
Injected templates |
Templates 2 and 7 (★ in figures) — two realisations of family 2 |
Contamination model |
Additive: \(\delta_g^\mathrm{obs} = \delta_g^\mathrm{clean} + a \,\delta_{t_2} + a \,\delta_{t_7}\) |
Contamination levels |
low \((a=0.02)\), medium \((a=0.05)\), high \((a=0.10)\) |
GLASS mocks for ISD |
100 systematic-free full-sky mocks on the same footprint |
The figure-generating script is scripts/run_snr_preselection_demo.py.
HEALPix maps
The panel below shows the simulated galaxy overdensity, representative template maps, and the contaminated field at medium level.
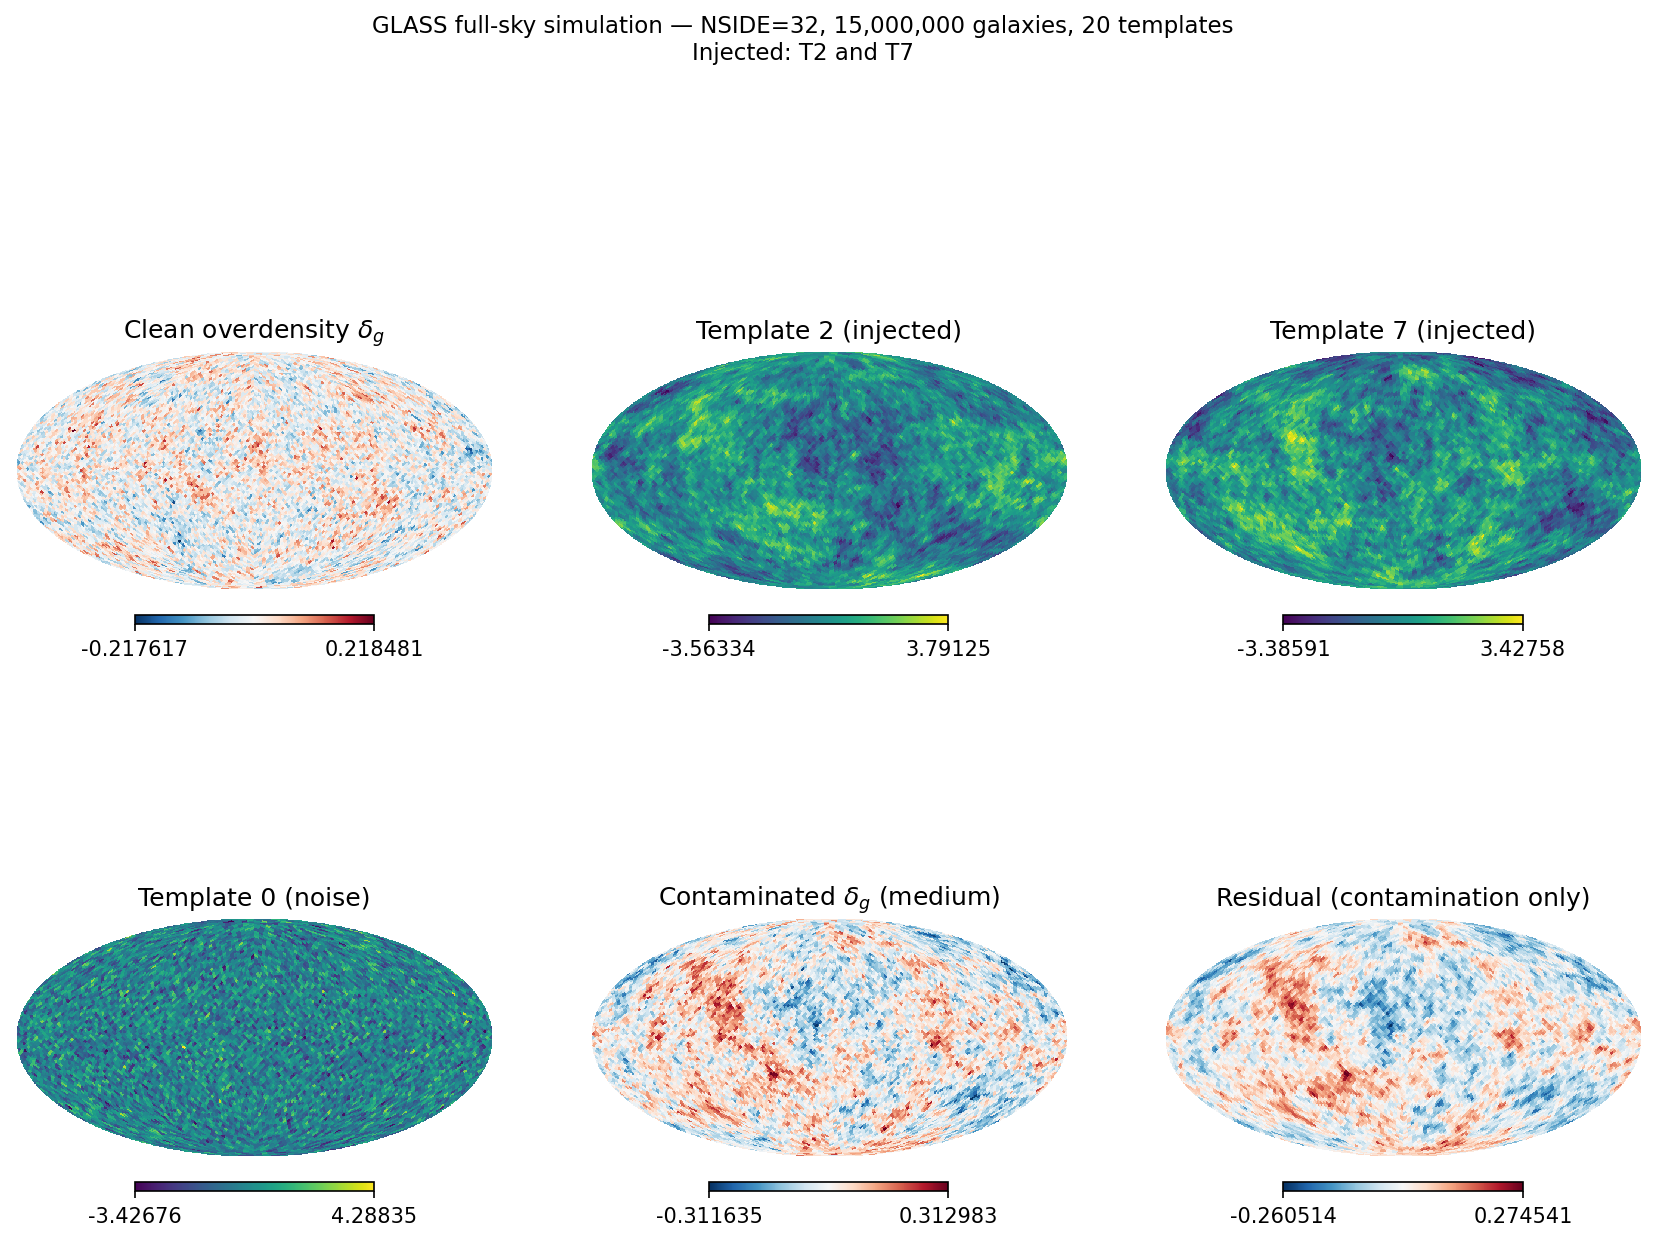
Left to right, top row: Clean galaxy overdensity \(\delta_g\), two injected templates (T2, T7), a representative noise template. Bottom row: Contaminated overdensity at medium level and the residual contamination signal.
SNR ranking
The bar charts below show the SNR score assigned to each template by each ranking method at the three contamination levels. The two injected templates (★) are coloured in coral red; noise templates in grey.
Data cross-correlation method
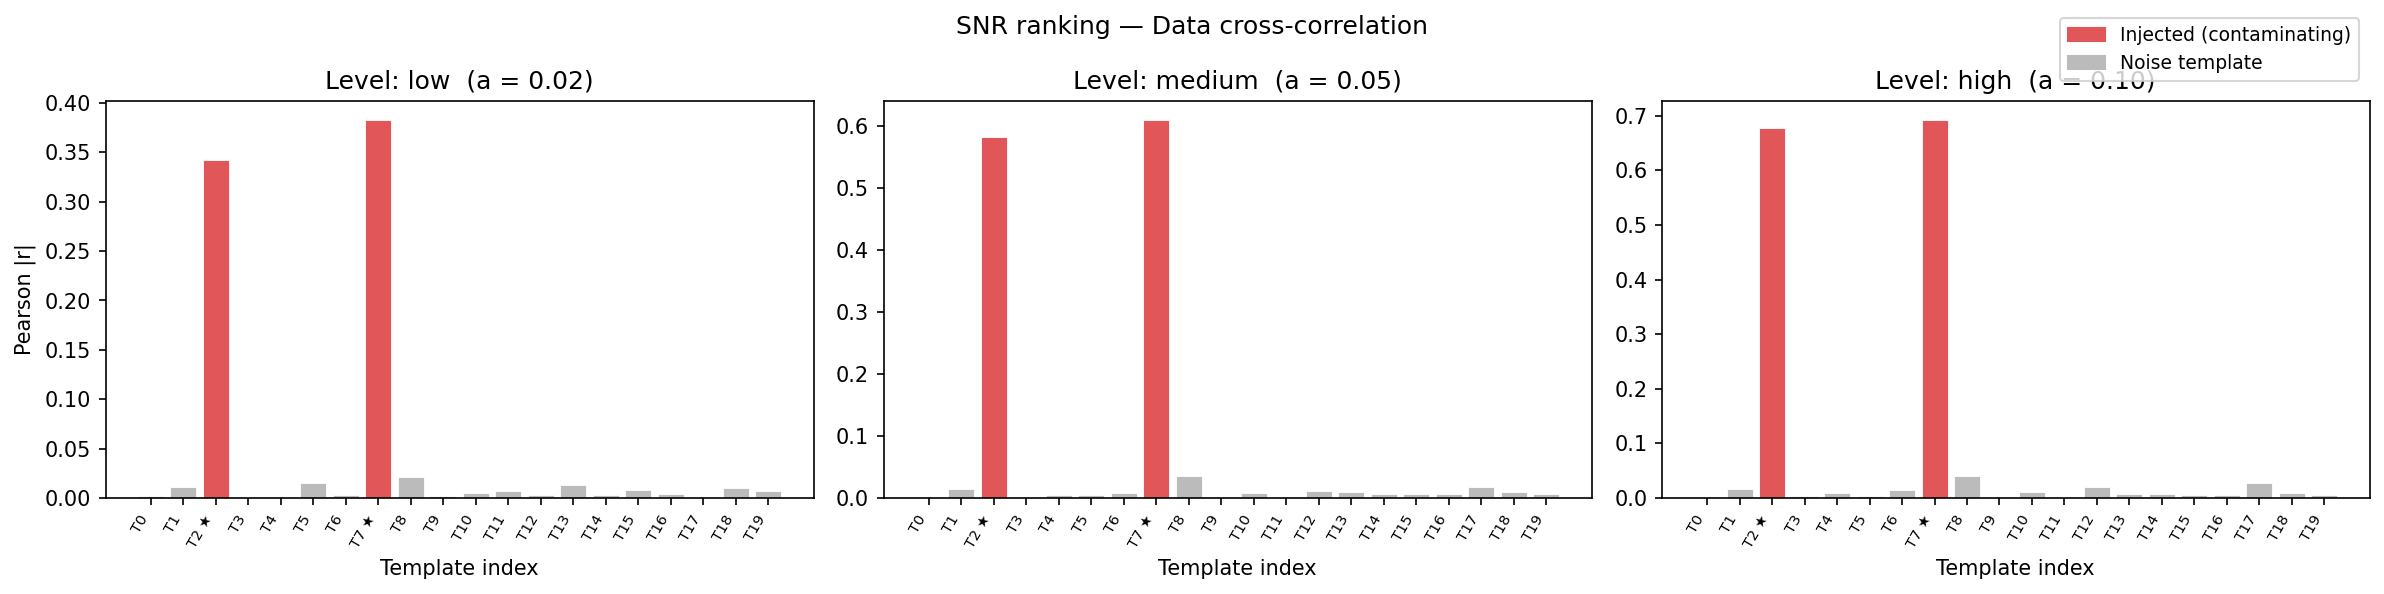
Data cross-correlation \(|r|\). Both injected templates rank first and second at all three contamination levels. Noise templates have scores consistent with zero within statistical fluctuations.
OLS t-statistic method
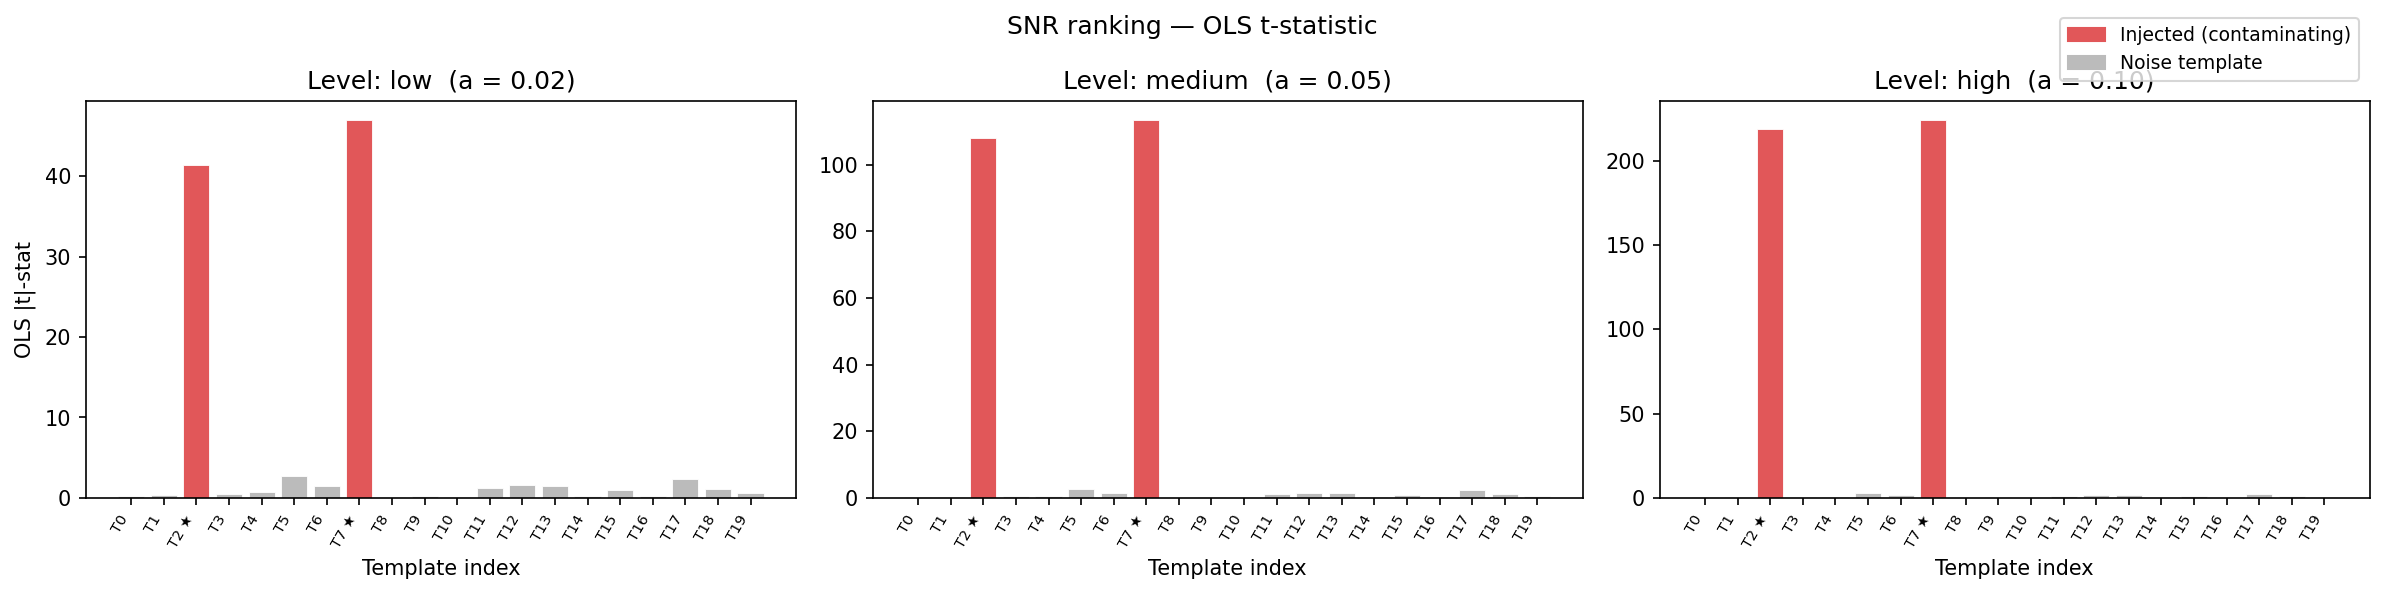
OLS \(|\hat\alpha|/\sigma_{\hat\alpha}\). The signal-to-noise ratio is generally sharper than the Pearson correlation because the template standard deviation is factored into the denominator.
ISD \(\Delta\chi^2\) method
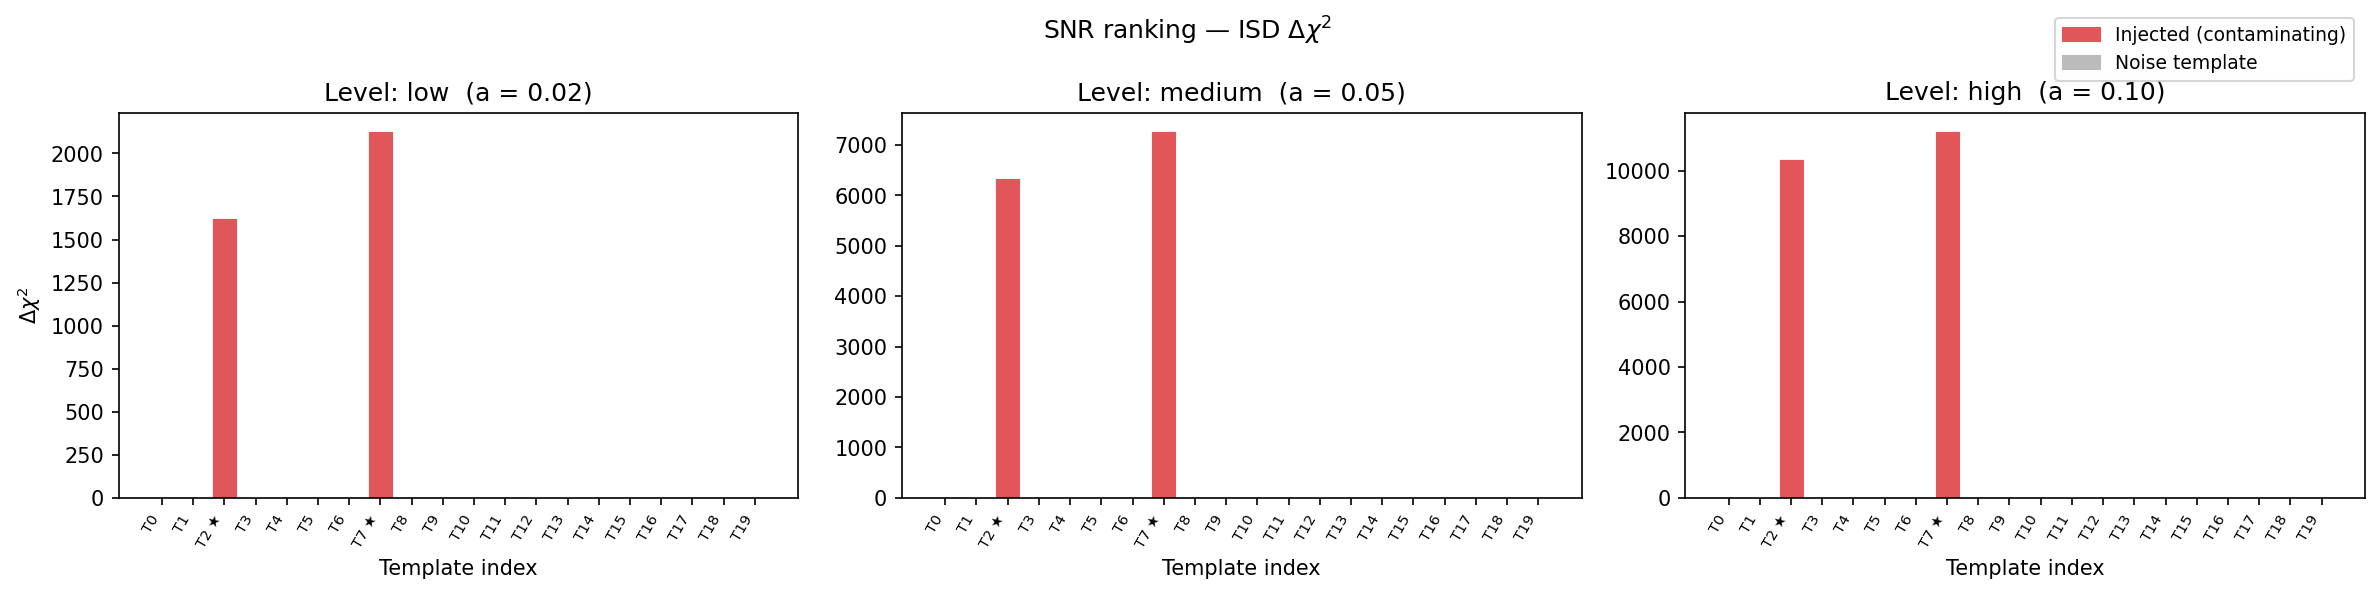
ISD \(\Delta\chi^2\) (Rodríguez-Monroy et al. 2025). The statistic grows quadratically with amplitude, making it highly sensitive at medium and high contamination but potentially less sensitive than the correlation at low levels.
Detection sensitivity vs amplitude
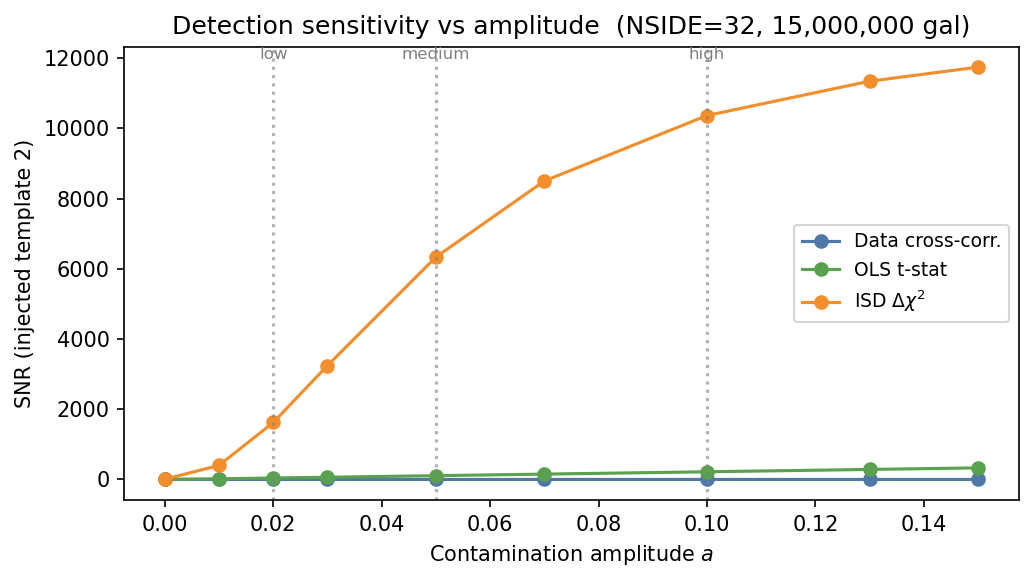
SNR assigned to injected template 2 as a function of contamination amplitude \(a\) for the three methods. Vertical dotted lines mark the three canonical levels. All methods increase monotonically with amplitude. The data and template methods are approximately linear in \(a\); the ISD \(\Delta\chi^2\) grows roughly as \(a^2\).
ISD mock-based p-values
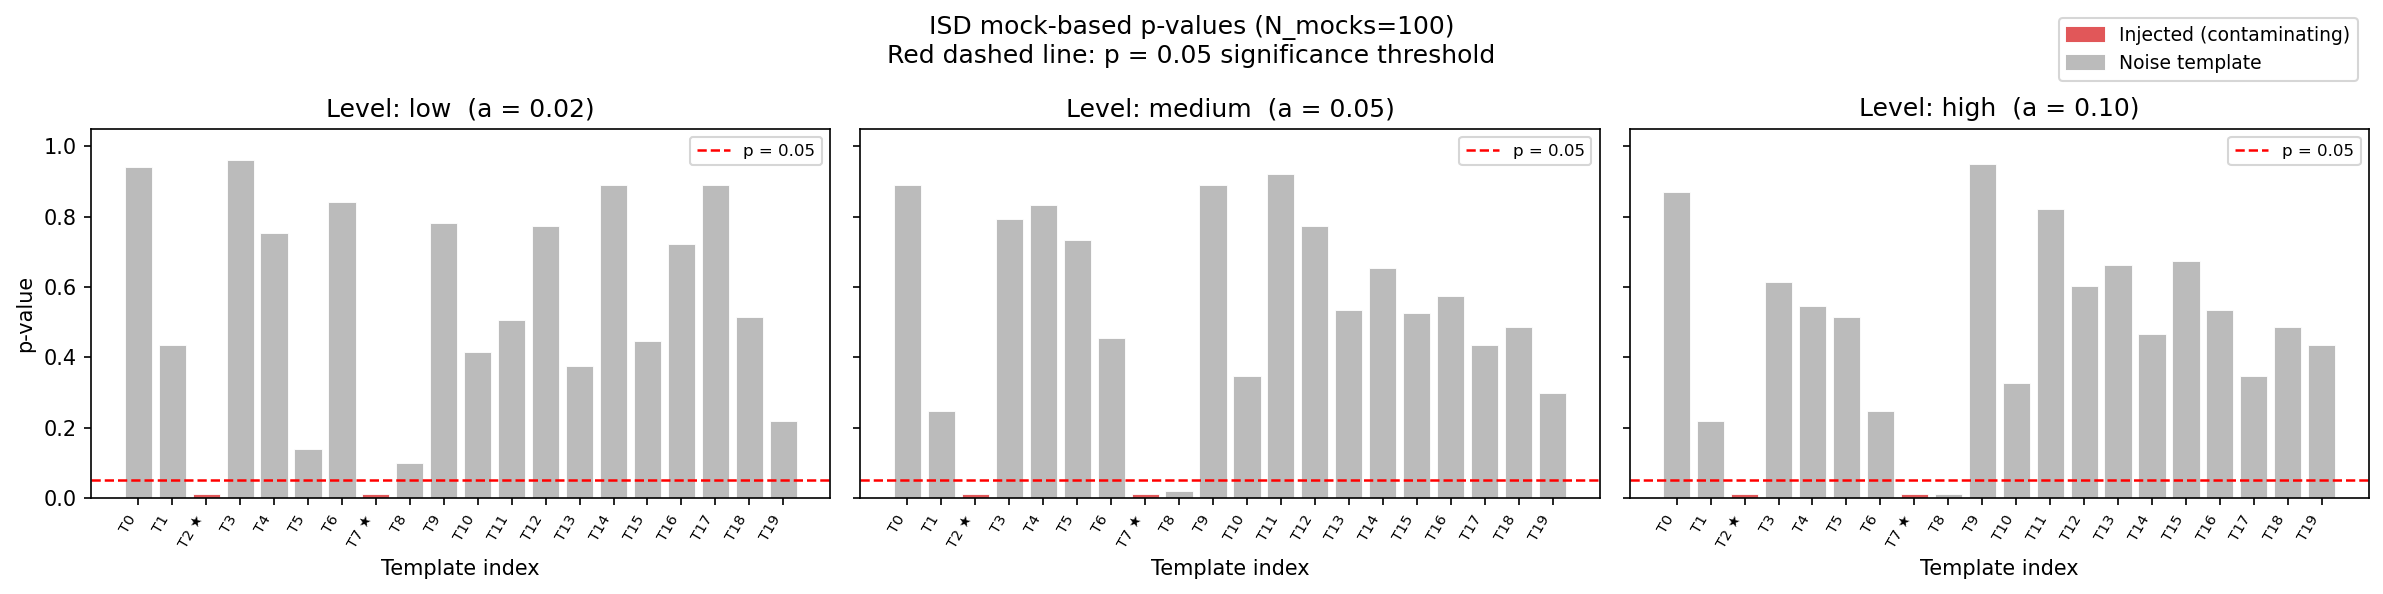
Mock-based p-values from sys_mapping.diagnostics.isd_template_significance()
with \(N_\mathrm{mocks} = 100\) GLASS systematic-free mocks.
The red dashed line marks the conventional \(p = 0.05\) threshold.
At all three levels, both injected templates (T2, T7) are significantly
detected (\(p \le 1/N_\mathrm{mocks}\)), while all 18 noise templates
scatter around \(p \sim 0.5\).
Full pipeline: pre-selection then decontamination
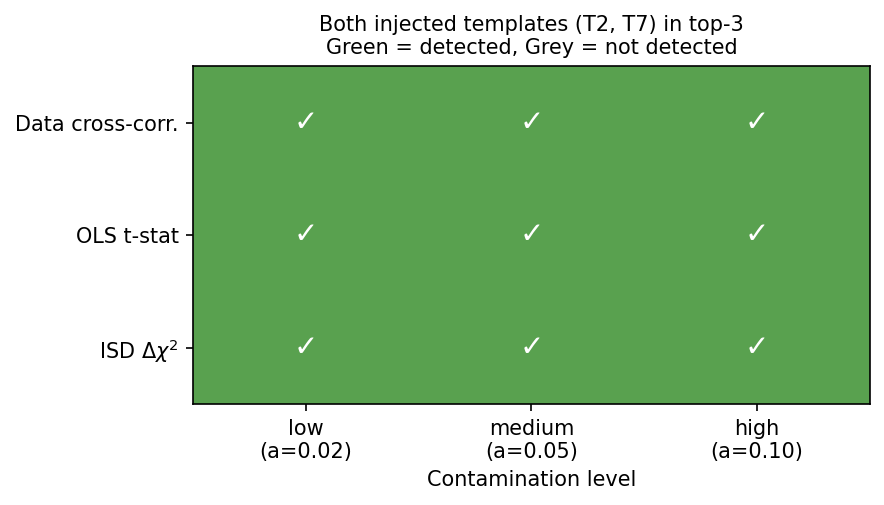
Detection summary: green cell = both injected templates T2 and T7 appear in the top-3 ranking (out of 20); grey cell = at least one is missed.
All three methods successfully recover both injected templates in the top-3 at every contamination level. In practice, selecting the top \(K\) templates (with \(K\) chosen conservatively, e.g. \(K = N/2\) of the initial pool) and then running greedy forward selection on the reduced set is a robust and computationally efficient strategy.
Computational cost
The ranking step is fast regardless of the galaxy count; it operates on pixelised maps (here: 12 288 values) and 20 templates.
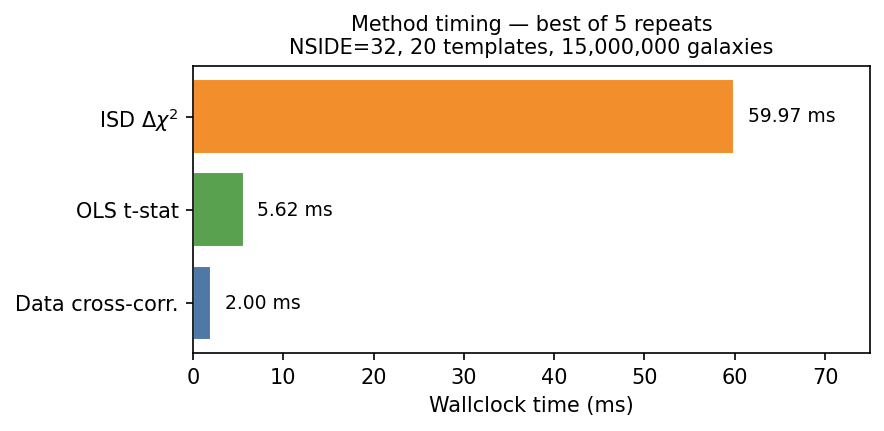
Best-of-5 wallclock time for a single call to
snr_template_ranking() with 20 templates on
NSIDE = 32.
Method |
Typical time |
Notes |
|---|---|---|
|
< 1 ms |
Pearson correlation; JAX batched matrix multiply — \(\mathcal{O}(n_\mathrm{pix} \times n_\mathrm{templates})\) |
|
< 1 ms |
Per-template OLS t-statistic; JAX vmap over templates |
|
1–10 ms |
JAX vmap over templates, fixed-size bins, analytic linear regression;
falls back to NumPy for |
The dominant runtime cost in practice is the GLASS mock generation for
isd_template_significance(): each of the
\(N_\mathrm{mocks}\) systematic-free mocks requires drawing galaxy
positions from the pixelised density field (\(\mathcal{O}(N_\mathrm{total})\)).
At 15 M galaxies and rand_factor=2, each mock takes roughly 1–5 s,
making the total ISD significance cost
\(\sim N_\mathrm{mocks} \times 3\,\mathrm{s}\) on a modern workstation.
Choosing the number of mocks for ISD significance
The mock-based p-value estimate has a finite resolution of \(1/(N_\mathrm{mocks}+1)\) and a standard error that scales as \(\sim 1/\sqrt{N_\mathrm{mocks}}\) for noise-template p-values near 0.5. The figure below quantifies how many mocks are needed for the noise-template p-values to converge.
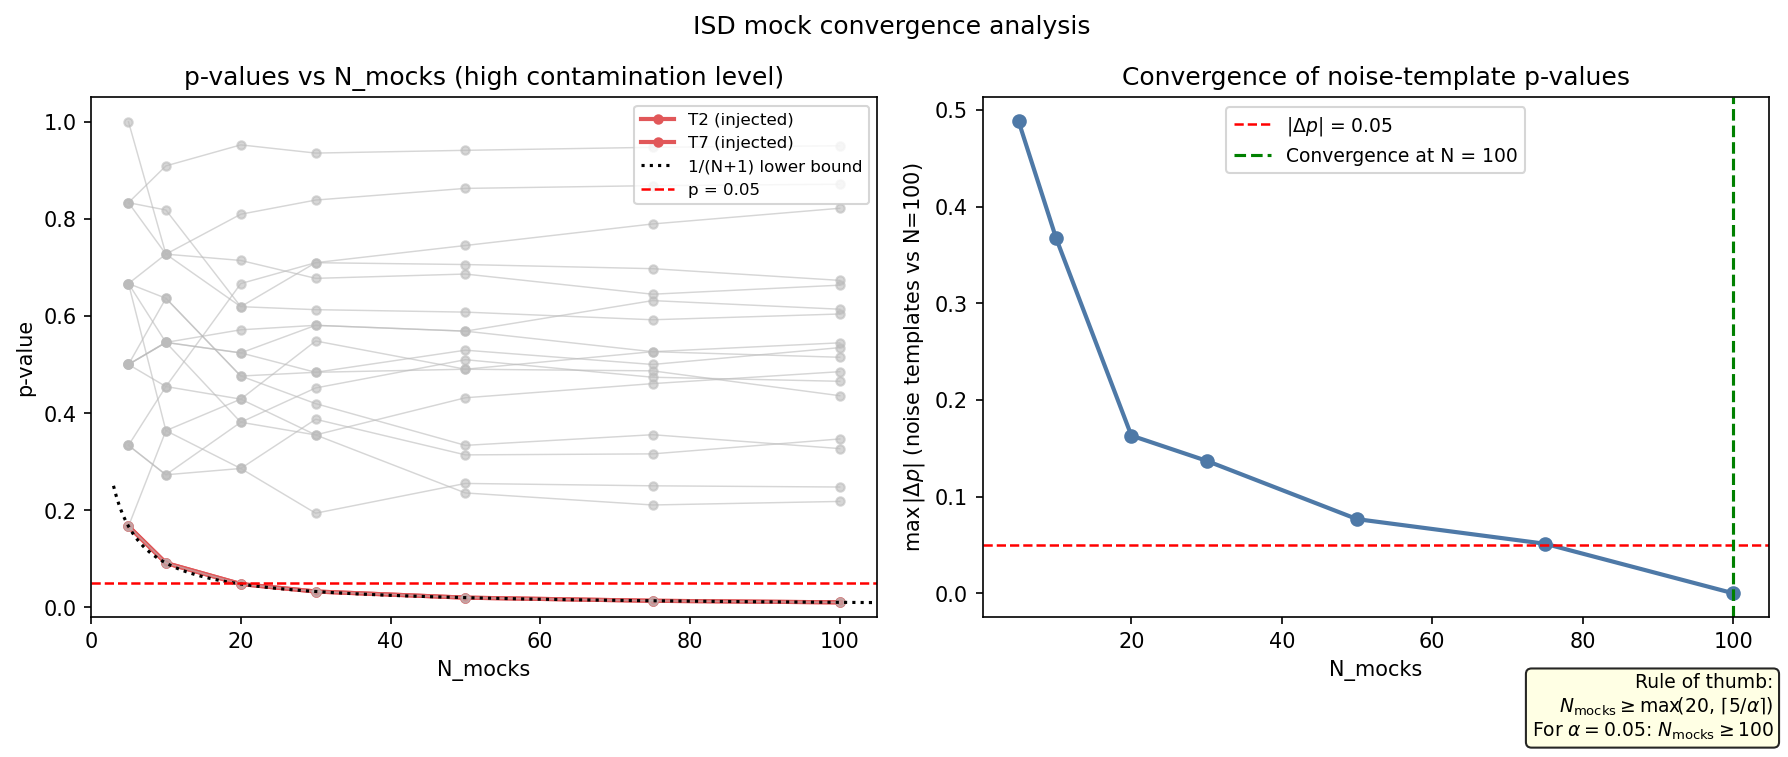
Left: p-values for all 20 templates as a function of \(N_\mathrm{mocks}\) (reusing the 100-mock run at the high contamination level by subsampling the mock \(\Delta\chi^2\) matrix). Coral lines = injected templates (T2, T7); grey lines = 18 noise templates; red dashed = \(p=0.05\) threshold; dotted black = theoretical lower bound \(1/(N+1)\). Right: convergence metric — maximum absolute change of any noise-template p-value relative to the \(N=100\) reference, as a function of \(N_\mathrm{mocks}\). The vertical green dashed line marks the first \(N\) where this change falls below 0.05.
The injected templates saturate at the minimum attainable p-value \(1/(N+1)\) from the very first few mocks, confirming that even \(N_\mathrm{mocks}=5\) is sufficient to detect a strongly contaminating template. The noise-template p-values, however, require more mocks to stabilise: the convergence metric falls below 0.05 only around \(N \approx 50\text{–}100\).
Rule of thumb:
where \(\alpha\) is the target significance level.
Target \(\alpha\) |
Minimum \(N_\mathrm{mocks}\) |
Notes |
|---|---|---|
0.10 |
50 |
Fast pre-screening |
0.05 |
100 |
Standard significance level |
0.01 |
500 |
High-confidence selection |
Conclusion
All three SNR ranking methods (data cross-correlation, OLS t-statistic, ISD \(\Delta\chi^2\)) correctly identify both injected templates as the highest-ranking candidates at all tested contamination amplitudes (\(a \ge 0.02\)) with 15 M galaxies and 20 templates.
The data and template methods are approximately linear in amplitude, reliable from the lowest tested level, and execute in < 1 ms. They are the fastest route to a short-list.
The ISD \(\Delta\chi^2\) method follows Rodríguez-Monroy et al. (2025). Its mock-based p-value provides a rigorous significance test without assumptions about the null distribution. The mock generation is the dominant cost; \(N_\mathrm{mocks} = 100\) is sufficient for a 5 % significance threshold.
Recommended workflow:
Run
method="data"on all candidate templates to build a short-list (< 1 ms; free).Apply
isd_template_significance()on the short-list with \(N_\mathrm{mocks} \ge 100\) to obtain rigorous p-values (minutes).Pass templates with \(p < 0.05\) to
greedy_forward_select()or the Bayesian MCMC pipeline.
API reference
- sys_mapping.diagnostics.snr_template_ranking(delta_g_obs, delta_t, *, method='template', n_bins=10, poly_order=1, fracdet=None)[source]
Rank systematic templates by signal-to-noise ratio of their contamination.
Four SNR definitions:
"template": \(|\hat\alpha_i| / \sigma_{\hat\alpha_i}\) from OLS."data": \(|\mathrm{Corr}(\delta_g, t_i)|\), the absolute cross-correlation between the galaxy field and each template."peak": peak pseudo-\(C_\ell\) cross-spectrum between \(\delta_g\) and \(t_i\), divided by the noise level."isd": \(\Delta\chi^2 = \chi^2_{\rm null} - \chi^2_{\rm model}\) from the ISD 1D binned relation (Rodríguez-Monroy et al. 2025, Eqs. 4–5). For each template, pixels are binned by template value; the fracdet-weighted mean galaxy density per bin is compared to a polynomial fit. Large \(\Delta\chi^2\) indicates significant systematic contamination.
- Parameters:
delta_g_obs (ndarray) – Observed galaxy overdensity (shape
(n_pix,)).delta_t (ndarray) – Template maps (shape
(n_sys, n_pix)).method (str) – One of
"template","data","peak","isd".n_bins (int) – Number of equal-width bins for
method="isd". Ignored otherwise.poly_order (int) – Polynomial degree for the 1D fit in
method="isd"(1 = linear, 3 = cubic as used in DES Y6). Ignored otherwise.fracdet (ndarray | None) – Per-pixel fractional coverage weights (shape
(n_pix,)). Only used bymethod="isd"; ifNone, uniform weights are assumed.
- Returns:
SNR value for each template (shape
(n_sys,)). Higher values indicate a more contaminating template.- Return type:
snr
Notes
Templates can be sorted by
np.argsort(snr)[::-1]to obtain a ranking from most to least contaminating. The"peak"method requireshealpy(already a package dependency) and assumes the overdensity map covers the full sky (or has zeros outside the mask).Examples
>>> import numpy as np
>>> from sys_mapping import snr_template_ranking
>>> rng = np.random.default_rng(0)
>>> n_pix, n_sys = 3000, 4
>>> delta_t = rng.standard_normal((n_sys, n_pix))
>>> # Inject strong contamination from template 2
>>> delta_g = 0.5 * delta_t[2] + rng.standard_normal(n_pix) * 0.2
>>> snr = snr_template_ranking(delta_g, delta_t, method="data")
>>> snr.shape
(4,)
>>> np.argmax(snr) == 2
True
References
Tanidis et al. 2026, MNRAS 547. Rodríguez-Monroy et al. 2025, arXiv:2509.07943, Sec. IV.A.1, Eqs. 4–5.
- sys_mapping.diagnostics.isd_template_significance(delta_g_obs, delta_t, good_pixels, nside, n_total, z_edges, nz, *, n_total_footprint=None, n_mocks=100, n_bins=10, poly_order=1, fracdet=None, seed=0, rand_factor=10)[source]
ISD Δχ² significance: compare data against systematic-free GLASS mocks.
For each template map, computes the ISD contamination metric \(\Delta\chi^2 = \chi^2_{\rm null} - \chi^2_{\rm model}\) on the data and on
n_mockssystematic-free GLASS mocks generated on the same footprint and redshift range. The fraction of mocks that exceed the data value defines the template’s p-value.- Parameters:
delta_g_obs (ndarray) – Observed galaxy overdensity at footprint pixels (shape
(n_good_pix,)).delta_t (ndarray) – Template maps at footprint pixels (shape
(n_sys, n_good_pix)).good_pixels (ndarray) – Boolean footprint mask over the full HEALPix sky (shape
(12 * nside**2,)).nside (int) – HEALPix resolution of the template and galaxy maps.
n_total (int) – Target galaxy count per GLASS mock (full-sky). Ignored when
n_total_footprintis provided.n_total_footprint (int | None) – Number of galaxies in the survey footprint (i.e.
len(ra_gal)from the real data). When provided,n_totalis computed automatically asn_total_footprint × n_full_pix / n_good_pixso that after trimming the mock togood_pixels, the footprint surface density matches the data. Preferred over passing a rawn_total.z_edges (ndarray) – Redshift bin edges for the n(z) model (length
n_bins_z + 1).nz (ndarray) – Galaxy counts per redshift bin (length
n_bins_z).n_mocks (int) – Number of systematic-free mocks to generate.
n_bins (int) – Number of template-value bins for the ISD 1D relation.
poly_order (int) – Polynomial degree for the 1D fit (1 = linear, 3 = cubic).
fracdet (ndarray | None) – Per-pixel fractional coverage weights (shape
(n_good_pix,)). IfNone, uniform weights are used.seed (int) – Base random seed; mock k uses
seed + k.rand_factor (int) – Ratio of random to galaxy counts in each GLASS mock. Reducing this (e.g. to 2) cuts memory usage and generation time proportionally with negligible effect on the overdensity estimate. Default is 10.
- Returns:
result –
"delta_chi2"— shape(n_sys,), Δχ² for the data."p_values"— shape(n_sys,), mock-based p-values in(0, 1]. Small values indicate significant systematic contamination."delta_chi2_mocks"— shape(n_mocks, n_sys), Δχ² distribution from systematic-free mocks.
- Return type:
dict with keys
Notes
Mocks are generated with
generate_glass_fullsky_mock(), pixelised withpixelize_catalog(), and restricted to the survey footprint viagood_pixels. The same template mapsdelta_tare used for both the data and the mocks.p-value formula (smoothed to avoid zero):
\[p_i = \frac{\#\{k : \Delta\chi^2_{\rm mock,k,i} \ge \Delta\chi^2_{\rm data,i}\} + 1}{n_{\rm mocks} + 1}\]Examples
>>> import numpy as np
>>> from sys_mapping import isd_template_significance
>>> rng = np.random.default_rng(0)
>>> n_pix, n_sys = 3072, 3   # nside=16 footprint size
>>> delta_t = rng.standard_normal((n_sys, n_pix))
>>> delta_g = 0.4 * delta_t[1] + rng.standard_normal(n_pix) * 0.1
>>> good = np.ones(12 * 16 ** 2, dtype=bool)
>>> z_edges = np.array([0.0, 0.5])
>>> nz = np.array([1000.0])
>>> result = isd_template_significance(
...     delta_g, delta_t, good, nside=16, n_total=3000,
...     z_edges=z_edges, nz=nz, n_mocks=5, seed=0)
>>> set(result.keys()) == {"delta_chi2", "p_values", "delta_chi2_mocks"}
True
>>> result["delta_chi2"].shape
(3,)
>>> result["p_values"].shape
(3,)
>>> result["delta_chi2_mocks"].shape
(5, 3)
References
Rodríguez-Monroy et al. 2025, arXiv:2509.07943, Sec. IV.A.1. Tessore et al. 2023, OJAp, 6, 11.
- sys_mapping.model_selection.snr_preselect(delta_g_obs, delta_t, *, method='data', snr_min=None, n_top=None, n_bins=10, poly_order=1, fracdet=None)[source]
Rank and pre-select templates by SNR of their cross-correlation with data.
Step 1 of the two-stage decontamination pipeline: compute a cheap SNR metric for every candidate template and keep only those above a threshold and/or in the top-K by SNR. Pass the
selected_indicesoutput togreedy_forward_select()(or direct MCMC) for Step 2.For mock-based significance (the paper method), call
isd_template_significance()directly and threshold its"p_values"output.- Parameters:
delta_g_obs ((n_pix,) observed galaxy overdensity.)
delta_t ((n_cand, n_pix) candidate template pixel values.)
method (str) – SNR estimator; one of
"data","template","peak","isd". Default"data"(Pearson cross-correlation).snr_min (float | None) – Keep only templates with
snr >= snr_min. IfNone, no threshold is applied.n_top (int | None) – Keep at most the
n_tophighest-SNR templates. Applied aftersnr_min. IfNone, no cap is applied.n_bins (int) – Number of equal-width bins for
method="isd".poly_order (int) – Polynomial degree for the 1D fit in
method="isd".fracdet (ndarray | None) – Per-pixel fractional coverage weights for
method="isd".
- Returns:
.selected_indiceslists the accepted template indices in descending SNR order..snr_valuescontains the SNR for alln_initialtemplates (useful for inspection).- Return type:
Examples
>>> import numpy as np
>>> from sys_mapping import snr_preselect, greedy_forward_select
>>> rng = np.random.default_rng(0)
>>> n_pix, n_cand = 4000, 8
>>> delta_t = rng.standard_normal((n_cand, n_pix))
>>> delta_g = 0.6 * delta_t[3] + rng.standard_normal(n_pix) * 0.1
>>> pre = snr_preselect(delta_g, delta_t, method="data", n_top=4)
>>> len(pre.selected_indices)
4
>>> pre.selected_indices[0]  # template 3 should rank first
3
>>> pre.snr_values.shape
(8,)
- class sys_mapping.model_selection.SnrPreselectionResult(selected_indices, snr_values, method, snr_min, n_top, n_initial)[source]
Bases:
objectResult of
snr_preselect().- Parameters:
- snr_values
SNR/Δχ² for all
n_initialtemplates (shape(n_initial,)).- Type:
np.ndarray
- method
SNR estimator used (
"data","template","peak", or"isd").- Type:
- snr_min
Minimum SNR threshold applied, or
Noneif not used.- Type:
float or None
- n_top
Top-K cap applied, or
Noneif not used.- Type:
int or None
- n_initial
Total number of candidate templates passed in.
- Type:
- snr_values: ndarray
- method: str
- n_initial: int